Hydrology Banner

Victoria Falls

The Zambezi River flows at Victoria Falls continued decreasing, closing the period under review at 307m3/s on 29th October 2020. The flow observed on the same date last year was 107m3/s.

Date20202019
16-Oct-2020339134
17-Oct-2020334132
18-Oct-2020329129
19-Oct-2020325127
20-Oct-2020323125
21-Oct-2020320122
22-Oct-2020317120
23-Oct-2020317118
24-Oct-2020316116
25-Oct-2020315116
26-Oct-2020313113
27-Oct-2020312111
28-Oct-2020308109
29-Oct-2020307107
From: 
Friday, October 16, 2020
To: 
Thursday, October 29, 2020
Lake Levels Graphic: 

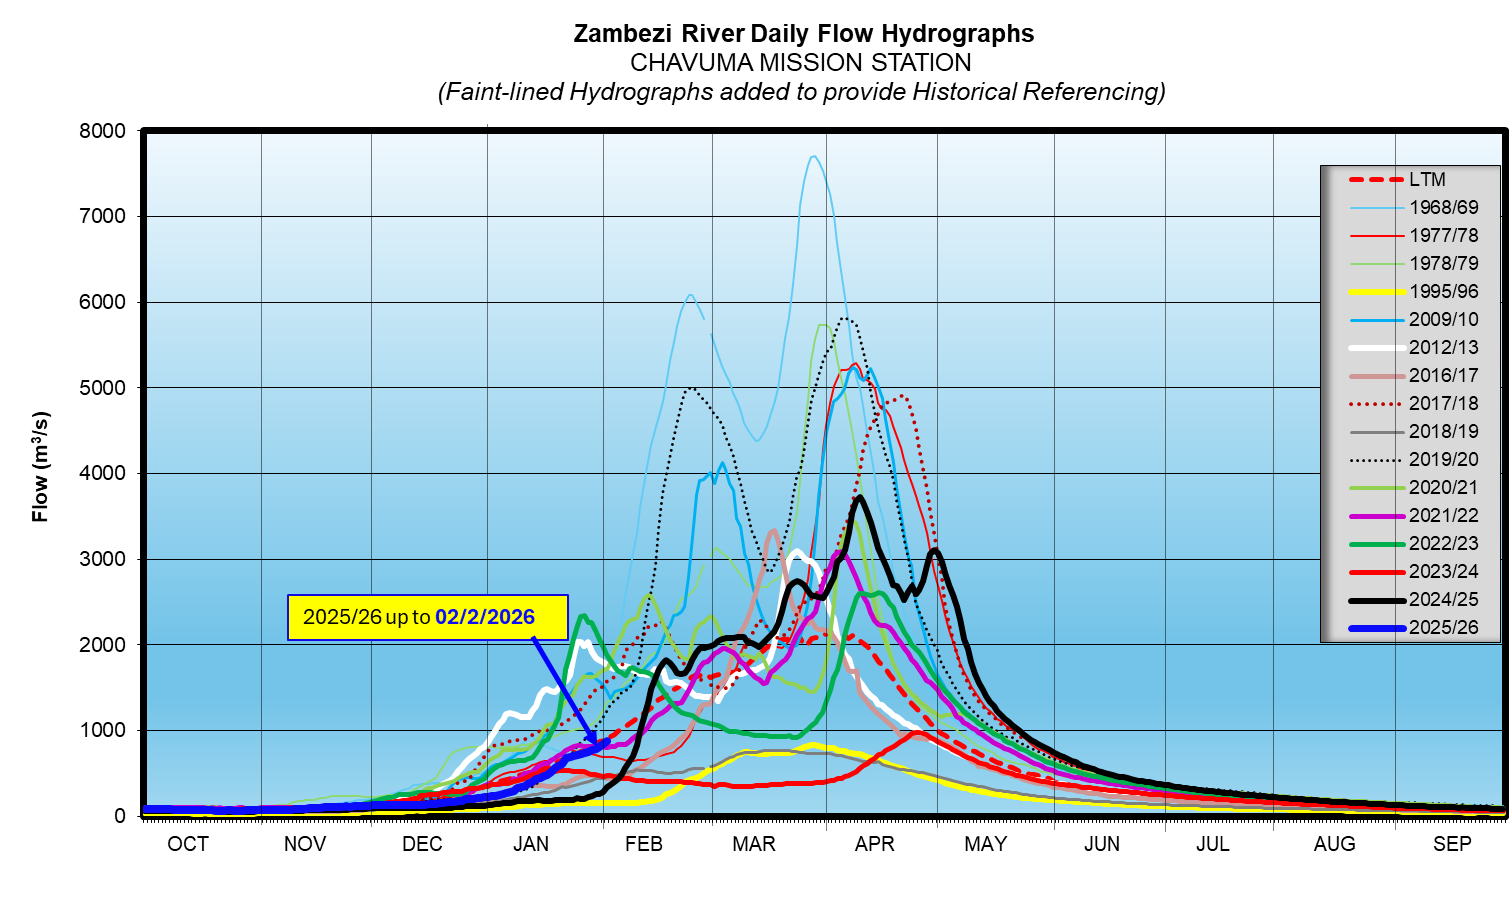
Chavuma

The Zambezi River flows at Chavuma are receding, closing the period under review at 295m3/s as of 14th July 2025, whilst last year on the same date it was much lower at 201m3/s.

From:
1 July 2025
To:
14 July 2025
DateFlow (m3/s)(2024/25)Flow (m3/s)(2023/24)
1-Jul366245
2-Jul360241
3-Jul354237
4-Jul351234
5-Jul344230
6-Jul338225
7-Jul333222
8-Jul328219
9-Jul320216
10-Jul316212
11-Jul311209
12-Jul304207
13-Jul298204
14-Jul295201
chavuma

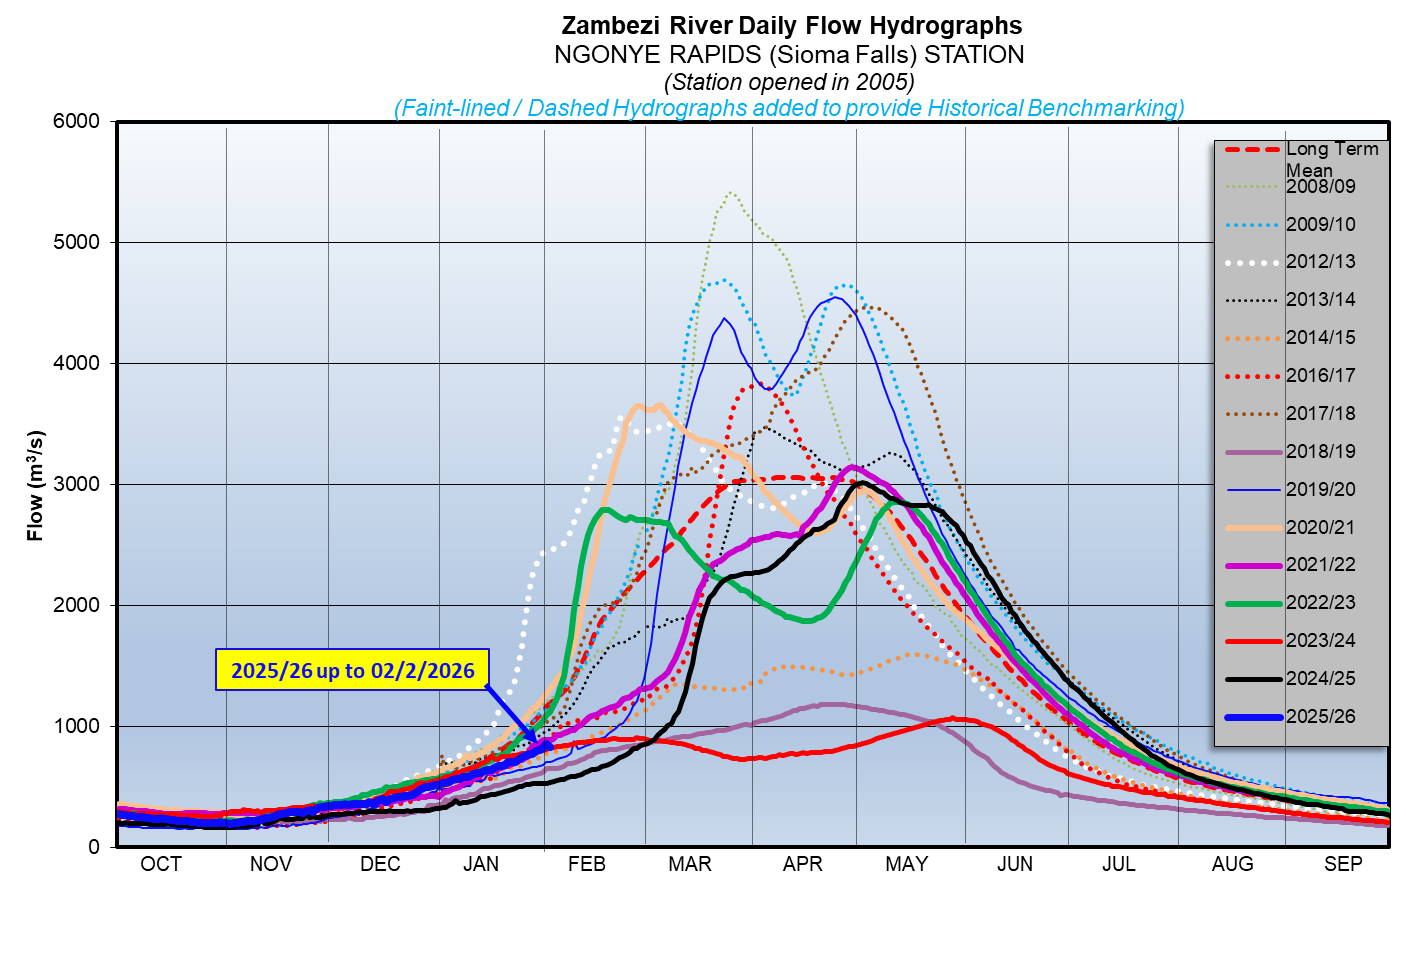
Ngonye

Flows at Ngonye are receding, closing the period under review at 995m3/s as of 14th July 2025. The flow recorded last year on the same date was lower at 500m3/s.

From:
1 July 2025
To:
14 July 2025
DateFlow (m3/s)(2024/25)Flow (m3/s)(2023/24)
1-Jul1,336602
2-Jul1,321593
3-Jul1,295584
4-Jul1,267573
5-Jul1,239566
6-Jul1,208557
7-Jul1,177548
8-Jul1,152542
9-Jul1,129534
10-Jul1,099528
11-Jul1,075521
12-Jul1,047514
13-Jul1,028503
14-Jul995500
ngonye

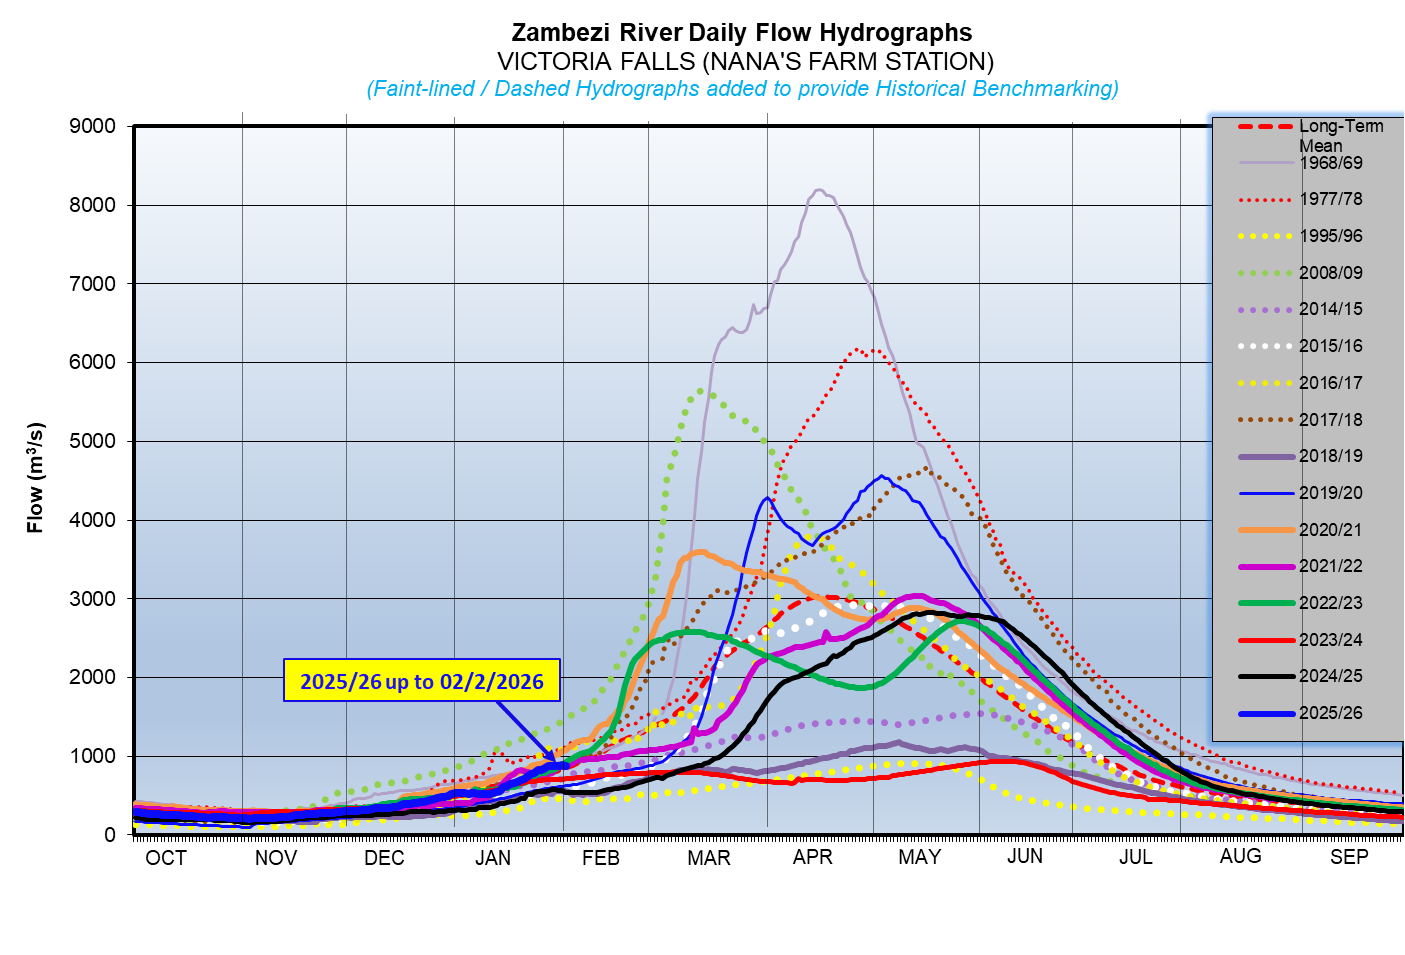
Victoria Falls (Nana’s Farm Station)

The Zambezi River flows at Victoria Falls – Nana’s Farm Station are in recession, closing the period under review at 1,258m3/s as of 14th July 2025.  The flow observed on the same date last year was lower at 500m3/s.

From:
1 July 2025
To:
14 July 2025
DateFlow (m3/s)(2024/25)Flow (m3/s)(2023/24)
1-Jul1,744623
2-Jul1,700609
3-Jul1,663597
4-Jul1,624586
5-Jul1,582575
6-Jul1,545564
7-Jul1,506555
8-Jul1,468544
9-Jul1,429535
10-Jul1,396527
11-Jul1,361519
12-Jul1,332514
13-Jul1,296506
14-Jul1,258500
vic-falls