Hydrology Banner

Victoria Falls

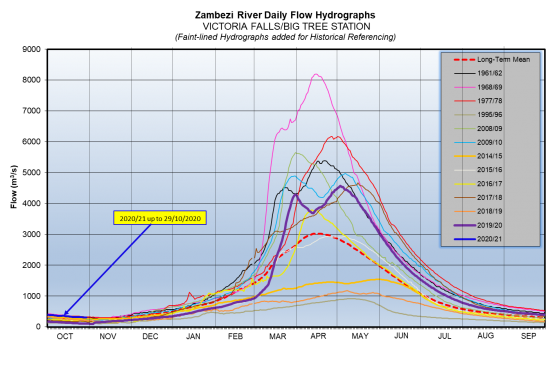
The Zambezi River flows at Victoria Falls continued decreasing, closing the period under review at 307m3/s on 29th October 2020. The flow observed on the same date last year was 107m3/s.

Date2020 Flow (m3/s)2019 Flow (m3/s)
16-Oct-2020339134
17-Oct-2020334132
18-Oct-2020329129
19-Oct-2020325127
20-Oct-2020323125
21-Oct-2020320122
22-Oct-2020317120
23-Oct-2020317118
24-Oct-2020316116
25-Oct-2020315116
26-Oct-2020313113
27-Oct-2020312111
28-Oct-2020308109
29-Oct-2020307107
From: 
Friday, October 16, 2020
To: 
Thursday, October 29, 2020
Lake Levels Graphic: 

Chavuma

The Zambezi River flows at Chavuma are in recession, closing the period under review at 65m3/s as of 20th October 2025, whilst last year on the same date it was lower at 54m3/s.

From:
7 October 2025
To:
20 October 2025
DateFlow (m3/s)(2024/25)Flow (m3/s)(2023/24)
7-Oct7863
8-Oct7862
9-Oct7761
10-Oct7661
11-Oct7660
12-Oct7560
13-Oct7459
14-Oct7257
15-Oct7257
16-Oct7056
17-Oct6855
18-Oct6855
19-Oct6655
20-Oct6554

Ngonye

The Zambezi River flows at Chavuma are in recession, closing the period under review at 65m3/s as of 20th October 2025, whilst last year on the same date it was lower at 54m3/s.

From:
7 October 2025
To:
20 October 2025
DateFlow (m3/s)(2024/25)Flow (m3/s)(2023/24)
7-Oct248191
8-Oct246195
9-Oct244191
10-Oct243189
11-Oct235186
12-Oct234183
13-Oct236183
14-Oct230183
15-Oct228196
16-Oct227186
17-Oct222185
18-Oct220182
19-Oct216178
20-Oct214176

Victoria Falls (Nana’s Farm Station)

The Zambezi River flows at Chavuma are in recession, closing the period under review at 65m3/s as of 20th October 2025, whilst last year on the same date it was lower at 54m3/s.

From:
7 October 2025
To:
20 October 2025
DateFlow (m3/s)(2024/25)Flow (m3/s)(2023/24)
7-Oct268203
8-Oct264203
9-Oct260203
10-Oct256200
11-Oct254199
12-Oct253198
13-Oct252196
14-Oct247197
15-Oct243197
16-Oct241195
17-Oct240196
18-Oct236197
19-Oct233197
20-Oct230196