Hydrology Banner

Victoria Falls

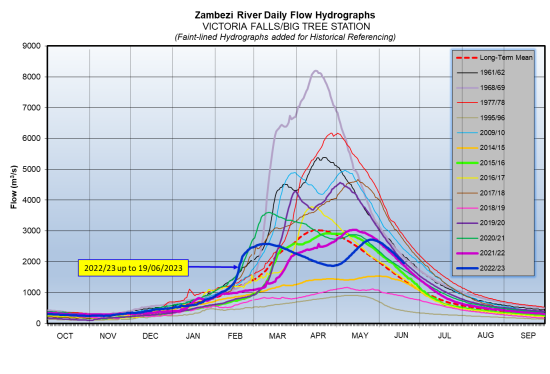
The Zambezi River flows at Victoria Falls are now decreasing after peaking for the second time, closing the period under review at 1,959m3/s on 19th June 2023. The flow observed on the same date last year was 1,872m3/s.

6-Jun2,4802,420
7-Jun2,4452,376
8-Jun2,4092,336
9-Jun2,3692,292
10-Jun2,3302,255
11-Jun2,2952,212
12-Jun2,2572,197
13-Jun2,2122,128
14-Jun2,1672,082
15-Jun2,1222,046
16-Jun2,0822,000
17-Jun2,0401,959
18-Jun1,9981,917
19-Jun1,9591,872
From: 
Tuesday, June 6, 2023
To: 
Monday, June 19, 2023
Lake Levels Graphic: 

Chavuma

The Zambezi River flows at Chavuma are decreasing steadily, closing the period under review at 2,584m3/s as of 5th May 2025, whilst last year on the same date it was much lower at 774m3/s.

From:
29 April 2025
To:
5 May 2025
DateFlow (m3/s)(2024/25)Flow (m3/s)(2023/24)
29-Apr3,065916
30-Apr3,103891
1-May3,074870
2-May2,971843
3-May2,842821
4-May2,695799
5-May2,584774
chavuma

Ngonye

Flows at Ngonye peaked to 3,014m3/s on 2nd May 2025, before decreasing steadily, closing the period under review at 2,982m3/s as of 5th May 2025. The flow recorded last year on the same date was lower at 880m3/s.

From:
29 April 2025
To:
5 May 2025
DateFlow (m3/s)(2024/25)Flow (m3/s)(2023/24)
29-Apr2,970834
30-Apr2,999839
1-May3,009852
2-May3,014860
3-May3,009867
4-May2,987877
5-May2,982880
ngonye

Victoria Falls (Nana’s Farm Station)

The Zambezi River flows at Victoria Falls – Nana’s Farm Station are increasing steadily, closing the period under review at 2,635m3/s on 5th May 2025.  The flow observed on the same date last year was lower at 735m3/s.

From:
29 April 2025
To:
5 May 2025
DateFlow (m3/s)(2024/25)Flow (m3/s)(2023/24)
29-Apr2,498711
30-Apr2,514716
1-May2,539723
2-May2,559726
3-May2,582724
4-May2,612729
5-May2,635735
vicfalls