Hydrology Banner

Victoria Falls

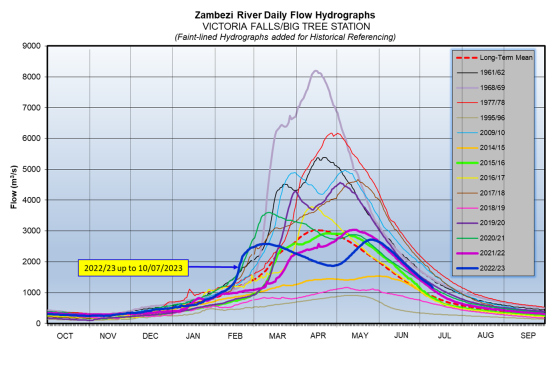
The Zambezi River flows at Victoria Falls are now decreasing, closing the period under review at 1,162m3/s on 10th July 2023. The flow observed on the same date last year was 1,099m3/s.

DateFlow (m3/s)(2022/23)Flow (m3/s)(2021/22);;
27-Jun1,6341,545
28-Jun1,5931,509
29-Jun1,5571,472
30-Jun1,5211,442
01-Jul1,4851,405
02-Jul1,4511,372
03-Jul1,4141,341
04-Jul1,3831,305
05-Jul1,3501,273
06-Jul1,3161,239
07-Jul1,2821,204
08-Jul1,2501,162
09-Jul1,2181,133
10-Jul1,1621,099
From: 
Tuesday, June 27, 2023
To: 
Monday, July 10, 2023
Lake Levels Graphic: 

Chavuma

The Zambezi River flows at Chavuma are rising steadily as the rainfall season progresses, closing the period under review at 723m3/s as of 26th January 2026, whilst last year on the same date it was lower at 197m3/s.

From:
13 January 2026
To:
26 January 2026
DateFlow (m3/s)(2024/25)Flow (m3/s)(2023/24)
13-Jan399180
14-Jan428182
15-Jan443183
16-Jan465182
17-Jan475181
18-Jan511181
19-Jan557183
20-Jan585186
21-Jan613186
22-Jan677184
23-Jan688186
24-Jan704192
25-Jan713210
26-Jan723197

Ngonye

Flows at Ngonye are increasing with records of fluctuation being observed due to the influence of local rainfall activity, closing the period under review at 754m3/s as of 26th January 2026. The flow recorded last year on the same date was lower at 516m3/s.

From:
13 January 2026
To:
26 January 2026
DateFlow (m3/s)(2024/25)Flow (m3/s)(2023/24)
13-Jan616421
14-Jan626422
15-Jan638425
16-Jan641431
17-Jan650436
18-Jan668444
19-Jan674450
20-Jan675457
21-Jan706471
22-Jan703472
23-Jan707483
24-Jan716500
25-Jan749502
26-Jan754516

Victoria Falls (Nana’s Farm Station)

From:
13 January 2026
To:
26 January 2026
DateFlow (m3/s)(2024/25)Flow (m3/s)(2023/24)
13-Jan542378
14-Jan563397
15-Jan605401
16-Jan627415
17-Jan651420
18-Jan658431
19-Jan674441
20-Jan697458
21-Jan717466
22-Jan748527
23-Jan775517
24-Jan790538
25-Jan828547
26-Jan829547