Hydrology Banner

Victoria Falls

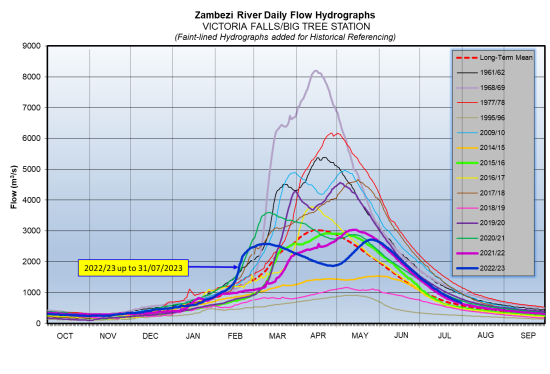
The Zambezi River flows at Victoria Falls are decreasing, closing the period under review at 675m3/s on 31st July 2023. The flow observed on the same date last year was 645m3/s.

18-Jul950873
19-Jul923849
20-Jul901823
21-Jul888803
22-Jul851784
23-Jul831767
24-Jul806745
25-Jul784730
26-Jul766714
27-Jul747700
28-Jul729685
29-Jul710672
30-Jul697658
31-Jul675645
From: 
Tuesday, July 18, 2023
To: 
Monday, July 31, 2023
Lake Levels Graphic: 

Chavuma

The Zambezi River flows at Chavuma are rising steadily, with records of fluctuations being observed due to the influence of local rainfall activity, closing the period under review at 127m3/s as of 12th December 2025, whilst last year on the same date it was lower at 94m3/s.

From:
29 November 2025
To:
12 December 2025
DateFlow (m3/s)(2024/25)Flow (m3/s)(2023/24)
29-Nov12285
30-Nov12389
1-Dec12595
2-Dec12496
3-Dec12795
4-Dec12893
5-Dec12795
6-Dec12893
7-Dec12991
8-Dec12791
9-Dec12694
10-Dec12696
11-Dec12596
12-Dec12794

Ngonye

Flows at Ngonye are increasing with records of fluctuation being observed due to local rainfall activity, closing the period under review at 370m3/s as of 12th December 2025. The flow recorded last year on the same date was lower at 296m3/s.

From:
29 November 2025
To:
12 December 2025
DateFlow (m3/s)(2024/25)Flow (m3/s)(2023/24)
29-Nov335255
30-Nov339261
1-Dec344269
2-Dec346269
3-Dec348270
4-Dec351273
5-Dec353276
6-Dec348277
7-Dec354277
8-Dec352285
9-Dec356292
10-Dec358290
11-Dec358290
12-Dec370296

Victoria Falls (Nana’s Farm Station)

The Zambezi River flows at Victoria Falls – Nana’s Farm Station are steadily rising, closing the period under review at 341m3/s as of 12th December 2025.  The flow observed on the same date last year was lower at 262m3/s.

From:
29 November 2025
To:
12 December 2025
DateFlow (m3/s)(2024/25)Flow (m3/s)(2023/24)
29-Nov296248
30-Nov301247
1-Dec303244
2-Dec303244
3-Dec308243
4-Dec306244
5-Dec312245
6-Dec314248
7-Dec316250
8-Dec328251
9-Dec337254
10-Dec338254
11-Dec341260
12-Dec341262