Hydrology Banner

Victoria Falls

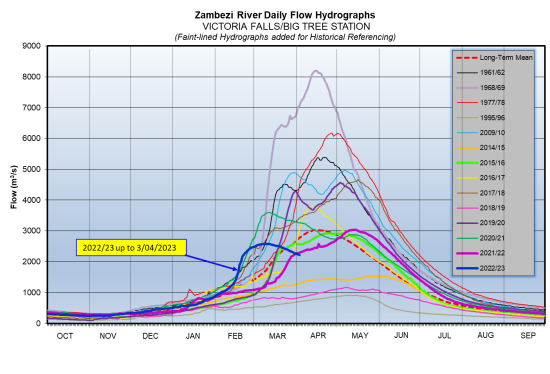
The Zambezi River flows at Victoria Falls are decreasing, closing the period under review at 2,227m3/s on 3rd April 2023. The flow observed on the same date last year was 2,297m3/s.

DateFlow (m3/s)(2022/23)Flow (m3/s)(2021/22)
21 March2,4651,624
22 March2,4471,69
23 March2,4251,764
24 March2,4071,846
25 March2,3961,94
26 March2,3762,029
27 March2,3542,099
28 March2,332,173
29 March2,3122,195
30 March2,292,225
31 March2,2712,257
01 April2,2552,273
02 April2,242,288
03 April2,2272,297
From: 
Tuesday, March 21, 2023
To: 
Monday, April 3, 2023
Lake Levels Graphic: 

Chavuma

The Zambezi River flows at Chavuma are decreasing after peaking to 3,851m3/s as at 18th March 2026, before dropping to 2,922m3/s at the close of the period under review of 30th March 2026, whilst last year on the same date it was lower at 2,554m3/s.

From:
17 March 2026
To:
30 March 2026
DateFlow (m3/s)(2025/26)Flow (m3/s)(2024/25)
17-Mar3,8052,101
18-Mar3,8512,148
19-Mar3,7732,244
20-Mar3,6262,390
21-Mar3,4322,538
22-Mar3,2712,677
23-Mar3,1362,722
24-Mar2,9892,742
25-Mar2,8642,731
26-Mar2,7682,697
27-Mar2,8462,632
28-Mar2,9132,584
29-Mar2,9292,570
30-Mar2,9222,554

Ngonye

Flows at Ngonye are steadily decreasing, with fluctuations being observed in the flows, closing the period under review at 4,199m3/s as of 30th March 2026. The flow recorded last year on the same date was lower at 2,261m3/s.

From:
17 March 2026
To:
30 March 2026
DateFlow (m3/s)(2025/26)Flow (m3/s)(2024/25)
17-Mar4,1961,902
18-Mar4,2071,995
19-Mar4,1992,062
20-Mar4,1902,101
21-Mar4,2532,142
22-Mar4,2702,179
23-Mar4,2862,201
24-Mar4,2752,221
25-Mar4,2532,237
26-Mar4,2342,239
27-Mar4,2262,246
28-Mar4,2232,257
29-Mar4,2012,261
30-Mar4,1992,261

Victoria Falls (Nana’s Farm Station)

The Zambezi River flows at Victoria Falls – Nana’s Farm Station are increasing as rainfall season progresses, closing the period under review at 4,206m3/s as of 30th March 2026.  The flow observed on the same date last year was lower at 1,647m3/s.

From:
17 March 2026
To:
30 March 2026
DateFlow (m3/s)(2025/26)Flow (m3/s)(2024/25)
17-Mar3,313984
18-Mar3,5561,012
19-Mar3,7021,049
20-Mar3,8401,080
21-Mar3,9661,123
22-Mar4,0351,160
23-Mar4,0901,216
24-Mar4,1361,271
25-Mar4,1521,325
26-Mar4,1651,385
27-Mar4,1871,447
28-Mar4,1921,519
29-Mar4,2001,586
30-Mar4,2061,647