Hydrology Banner

Victoria Falls

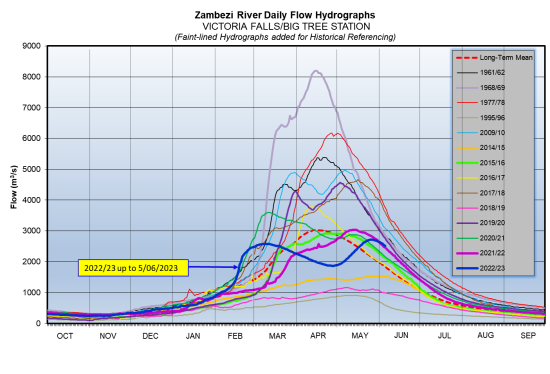
The Zambezi River flows at Victoria Falls are now decreasing after peaking for the second time, closing the period under review at 2,514m3/s on 5th June 2023. The flow observed on the same date last year was 2,463m3/s.

DateFlow (m3/s)(2022/23)Flow (m3/s)(2021/22)
23-May2,6852,896
24-May2,7012,872
25-May2,7132,855
26-May2,7152,830
27-May2,7182,804
28-May2,7082,773
29-May2,6902,741
30-May2,6742,718
31-May2,6582,667
01-Jun2,6352,628
02-Jun2,6122,582
03-Jun2,5842,537
04-Jun2,5482,494
05-Jun2,5142,463
From: 
Tuesday, May 23, 2023
To: 
Monday, June 5, 2023
Lake Levels Graphic: 

Chavuma

The Zambezi River flows at Chavuma are steadily decreasing, closing the period under review at 1,830m3/s as of 27th April 2026, whilst last year on the same date it was at 2,749m3/s.

From:
14 April 2026
To:
27 April 2026
DateFlow (m3/s)(2025/26)Flow (m3/s)(2024/25)
14-Apr2,7443,259
15-Apr2,7103,127
16-Apr2,6903,019
17-Apr2,6672,916
18-Apr2,6172,803
19-Apr2,5522,692
20-Apr2,4692,682
21-Apr2,3992,601
22-Apr2,3052,523
23-Apr2,2252,610
24-Apr2,1332,684
25-Apr2,0202,597
26-Apr1,9062,641
27-Apr1,8302,749

Ngonye

Flows at Ngonye are steadily decreasing, with records of fluctuation being observed due to localised rainfall activity within the catchment area, closing the period under review at 3,580m3/s as of 27th April 2026. The flow recorded last year on the same date was lower at 2,885m3/s.

From:
14 April 2026
To:
27 April 2026
DateFlow (m3/s)(2025/26)Flow (m3/s)(2024/25)
14-Apr3,6792,529
15-Apr3,6402,557
16-Apr3,6472,580
17-Apr3,6242,596
18-Apr3,6212,626
19-Apr3,6212,629
20-Apr3,6402,633
21-Apr3,6472,650
22-Apr3,6502,673
23-Apr3,6632,697
24-Apr3,6452,706
25-Apr3,6212,799
26-Apr3,6112,842
27-Apr3,5802,885

Victoria Falls (Nana’s Farm Station)

The Zambezi River flows at Victoria Falls – Nana’s Farm Station are steadily decreasing, closing the period under review at 3,700m3/s as of 27th April 2026.  The flow observed on the same date last year was lower at 2,467m3/s.

From:
14 April 2026
To:
27 April 2026
DateFlow (m3/s)(2025/26)Flow (m3/s)(2024/25)
14-Apr3,6792,529
15-Apr3,6402,557
16-Apr3,6472,580
17-Apr3,6242,596
18-Apr3,6212,626
19-Apr3,6212,629
20-Apr3,6402,633
21-Apr3,6472,650
22-Apr3,6502,673
23-Apr3,6632,697
24-Apr3,6452,706
25-Apr3,6212,799
26-Apr3,6112,842
27-Apr3,5802,885