Hydrology Banner

Victoria Falls / Big Tree

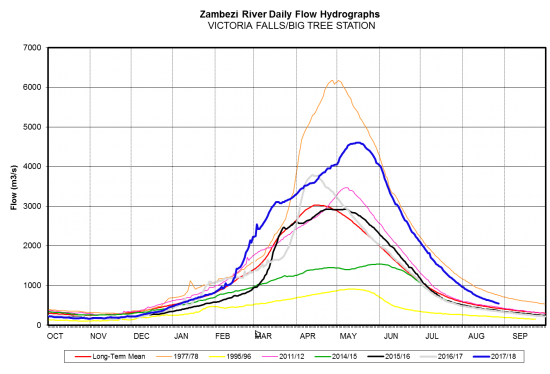
Flows at Victoria Falls have been decreasing closing the week under review at 548m3/s on 27th August 2018. Last year on the same date, the flow was 345m3/s.

Date Flow(m3/s)
21/08/2018610
22/08/2018604
23/08/2018591
24/08/2018573
25/08/2018560
26/08/2018554
27/08/2018548
From: 
Tuesday, August 21, 2018
To: 
Monday, August 27, 2018
Lake Levels Graphic: 
vic falls

Chavuma

The Zambezi River flows at Chavuma are receding, closing the period under review at 150m3/s as of 25th August 2025, whilst last year on the same date it was lower at 106m3/s.

From:
12 August 2025
To:
25 August 2025
DateFlow (m3/s)(2024/25)Flow (m3/s)(2023/24)
12-Aug185132
13-Aug182130
14-Aug178127
15-Aug175126
16-Aug173124
17-Aug170121
18-Aug168120
19-Aug165118
20-Aug163115
21-Aug160113
22-Aug158112
23-Aug156110
24-Aug153107
25-Aug150106
chavuma

Ngonye

Flows at Ngonye are receding, closing the period under review at 431m3/s as of 25th August 2025. The flow recorded last year on the same date was lower at 311m3/s.

From:
12 August 2025
To:
25 August 2025
DateFlow (m3/s)(2024/25)Flow (m3/s)(2023/24)
12-Aug527363
13-Aug516359
14-Aug510356
15-Aug500351
16-Aug494347
17-Aug487346
18-Aug480340
19-Aug472337
20-Aug465332
21-Aug460329
22-Aug454323
23-Aug443323
24-Aug442318
25-Aug431311
ngonye

Victoria Falls (Nana’s Farm Station)

The Zambezi River flows at Victoria Falls – Nana’s Farm Station are in recession, closing the period under review at 456m3/s as of 25th August 2025.  The flow observed on the same date last year was lower at 328m3/s.

From:
12 August 2025
To:
25 August 2025
DateFlow (m3/s)(2024/25)Flow (m3/s)(2023/24)
12-Aug562374
13-Aug550369
14-Aug540367
15-Aug530362
16-Aug519357
17-Aug513354
18-Aug508351
19-Aug497347
20-Aug492345
21-Aug485341
22-Aug478338
23-Aug466335
24-Aug459331
25-Aug456328
vic-falls