Hydrology Banner

Victoria Falls / Big Tree

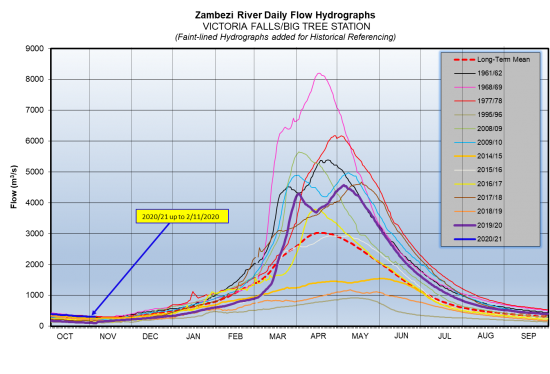
The Zambezi River flows at Victoria Falls continued decreasing, closing the period under review at 301m3/s on 2nd November 2020. The flow observed on the same date last year was 101m3/s.

DateFlow (m3/s) 2020Flow (m3/s) 2019
20/10/2020323125
21/10/2020320122
22/10/2020317120
23/10/2020317118
24/10/2020316116
25/10/2020315116
26/10/2020313113
27/10/2020312111
28/10/2020308109
29/10/2020307107
30/10/2020306105
31/10/2020304105
1/11/2020303101
2/11/2020301101
From: 
Tuesday, October 20, 2020
To: 
Monday, November 2, 2020
Lake Levels Graphic: 
vic-falls

Chavuma

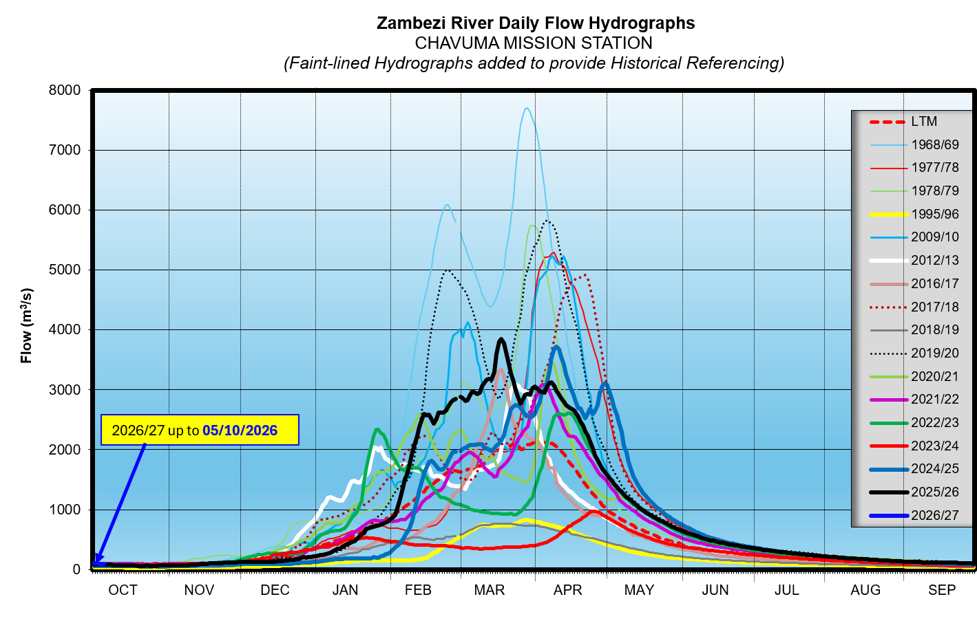
The Zambezi River flows at Chavuma are in recession, closing the period under review at 153m3/s as of 24th August 2026, whilst last year on the same date it was at 148m3/s.

From:
11 August 2026
To:
24 August 2026
DateFlow (m3/s)(2025/26)Flow (m3/s)(2024/25)
11-Aug183183
12-Aug181180
13-Aug177176
14-Aug175173
15-Aug173170
16-Aug171168
17-Aug169165
18-Aug166163
19-Aug164160
20-Aug162158
21-Aug160154
22-Aug157152
23-Aug155151
24-Aug153148

Ngonye

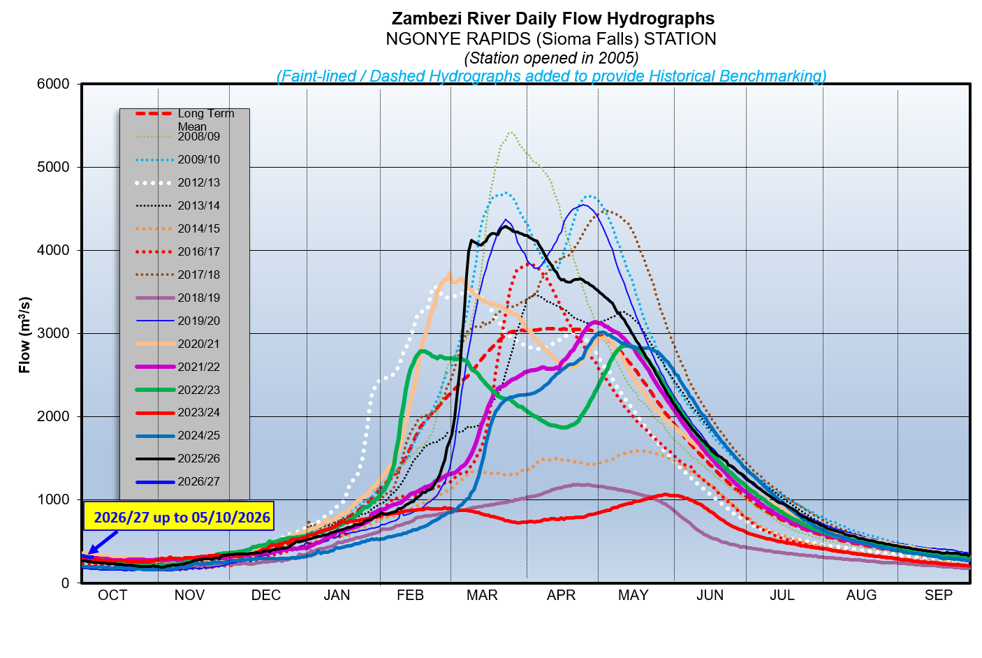
Flows at Ngonye are steadily decreasing, closing the period under review at 490m3/s as of 24th August 2026. The flow recorded last year on the same date was at 442m3/s.

From:
11 August 2026
To:
24 August 2026
DateFlow (m3/s)(2025/26)Flow (m3/s)(2024/25)
11-Aug577532
12-Aug569527
13-Aug566516
14-Aug557510
15-Aug548500
16-Aug539494
17-Aug535487
18-Aug525480
19-Aug516472
20-Aug513465
21-Aug507460
22-Aug499454
23-Aug492443
24-Aug490442

Victoria Falls (Nana’s Farm Station)

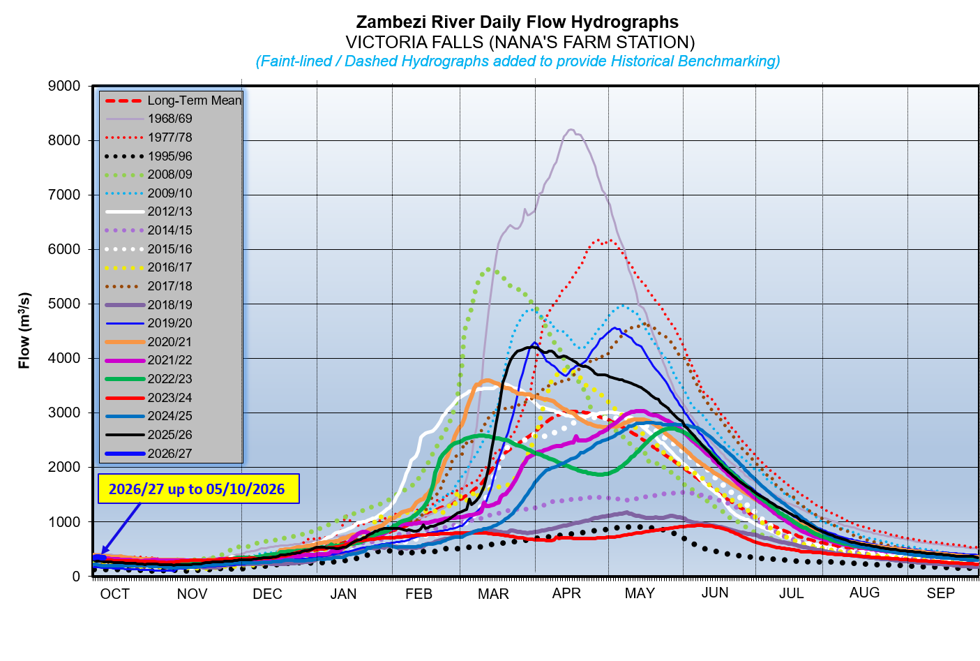
The Zambezi River flows at Victoria Falls – Nana’s Farm Station are steadily decreasing, closing the period under review at 510m3/s as of 24th August 2026.  The flow observed on the same date last year was at 459m3/s.

From:
11 August 2026
To:
24 August 2026
DateFlow (m3/s)(2025/26)Flow (m3/s)(2024/25)
11-Aug613570
12-Aug601562
13-Aug590550
14-Aug582540
15-Aug578530
16-Aug570519
17-Aug564513
18-Aug552508
19-Aug544497
20-Aug536492
21-Aug529485
22-Aug518478
23-Aug515466
24-Aug510459