Hydrology Banner

Victoria Falls / Big Tree

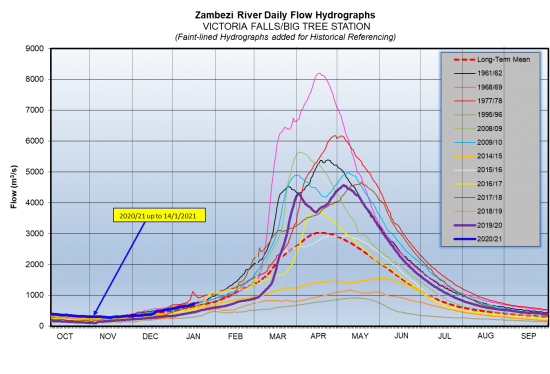
The Zambezi River flows at Victoria Falls have continued increasing steadily due to local rainfall activity and inflow from the Upper Catchment, closing the period under review at 733 m3/s on 14th January 2021. The flow observed on the same date last year was 457 m3/s.

DateFlow (m3/s) 2020Flow (m3/s) 2019
1/11/2021598349
2/1/2021610358
3/1/2021617368
4/1/2021623377
5/1/2021630382
6/1/2021636386
7/1/2021643396
8/1/2021643406
9/1/2021650416
10/1/2021656426
11/1/2021691431
12/1/2021698436
13/1/2021705447
14/1/2021733457
From: 
Friday, January 1, 2021
To: 
Thursday, January 14, 2021
Lake Levels Graphic: 

Chavuma

The Zambezi River flows at Chavuma are decreasing steadily, closing the period under review at 2,584m3/s as of 5th May 2025, whilst last year on the same date it was much lower at 774m3/s.

From:
29 April 2025
To:
5 May 2025
DateFlow (m3/s)(2024/25)Flow (m3/s)(2023/24)
29-Apr3,065916
30-Apr3,103891
1-May3,074870
2-May2,971843
3-May2,842821
4-May2,695799
5-May2,584774
chavuma

Ngonye

Flows at Ngonye peaked to 3,014m3/s on 2nd May 2025, before decreasing steadily, closing the period under review at 2,982m3/s as of 5th May 2025. The flow recorded last year on the same date was lower at 880m3/s.

From:
29 April 2025
To:
5 May 2025
DateFlow (m3/s)(2024/25)Flow (m3/s)(2023/24)
29-Apr2,970834
30-Apr2,999839
1-May3,009852
2-May3,014860
3-May3,009867
4-May2,987877
5-May2,982880
ngonye

Victoria Falls (Nana’s Farm Station)

The Zambezi River flows at Victoria Falls – Nana’s Farm Station are increasing steadily, closing the period under review at 2,635m3/s on 5th May 2025.  The flow observed on the same date last year was lower at 735m3/s.

From:
29 April 2025
To:
5 May 2025
DateFlow (m3/s)(2024/25)Flow (m3/s)(2023/24)
29-Apr2,498711
30-Apr2,514716
1-May2,539723
2-May2,559726
3-May2,582724
4-May2,612729
5-May2,635735
vicfalls