Hydrology Banner

Victoria Falls / Big Tree

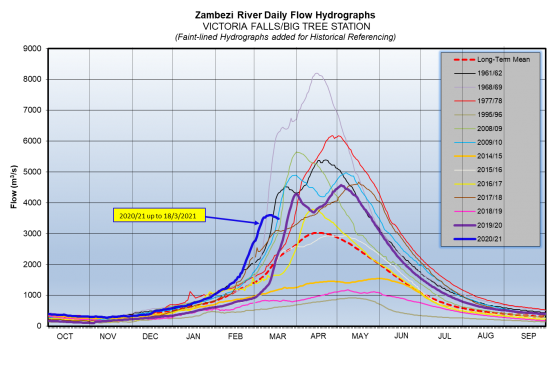
The Zambezi River flows at Victoria Falls peaked to 3,597 m3/s as of 11th and 12th of March 2021, before decreasing steadily due to reduced rainfall activity and inflow from the upper Kariba Catchment, closing the period under review at 3,483m3/s on 18th March 2021. The flow observed on the same date last year was 2,398m3/s.

DateFlow (m3/s) 2020/21Flow (m3/s) 2019/20
5/3/20213,3051,095
6/3/20213,4531,139
7/3/20213,5141,185
8/3/20213,5161,227
9/3/20213,5691,276
10/3/20213,5841,328
11/3/20213,5971,382
12/3/20213,5971,507
13/3/20213,5901,630
14/3/20213,5591,800
15/3/20213,5441,975
16/3/20213,5312,146
17/3/20213,5002,284
18/3/20213,4832,398
From: 
Friday, March 5, 2021
To: 
Thursday, March 18, 2021
Lake Levels Graphic: 
vic-falls

Chavuma

The Zambezi River flows at Chavuma are decreasing steadily, closing the period under review at 2,584m3/s as of 5th May 2025, whilst last year on the same date it was much lower at 774m3/s.

From:
29 April 2025
To:
5 May 2025
DateFlow (m3/s)(2024/25)Flow (m3/s)(2023/24)
29-Apr3,065916
30-Apr3,103891
1-May3,074870
2-May2,971843
3-May2,842821
4-May2,695799
5-May2,584774
chavuma

Ngonye

Flows at Ngonye peaked to 3,014m3/s on 2nd May 2025, before decreasing steadily, closing the period under review at 2,982m3/s as of 5th May 2025. The flow recorded last year on the same date was lower at 880m3/s.

From:
29 April 2025
To:
5 May 2025
DateFlow (m3/s)(2024/25)Flow (m3/s)(2023/24)
29-Apr2,970834
30-Apr2,999839
1-May3,009852
2-May3,014860
3-May3,009867
4-May2,987877
5-May2,982880
ngonye

Victoria Falls (Nana’s Farm Station)

The Zambezi River flows at Victoria Falls – Nana’s Farm Station are increasing steadily, closing the period under review at 2,635m3/s on 5th May 2025.  The flow observed on the same date last year was lower at 735m3/s.

From:
29 April 2025
To:
5 May 2025
DateFlow (m3/s)(2024/25)Flow (m3/s)(2023/24)
29-Apr2,498711
30-Apr2,514716
1-May2,539723
2-May2,559726
3-May2,582724
4-May2,612729
5-May2,635735
vicfalls