Hydrology Banner

Victoria Falls / Big Tree

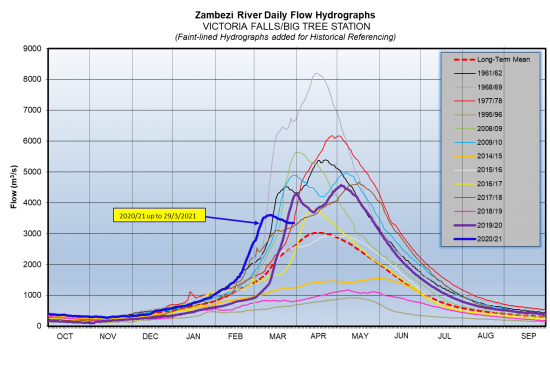
The Zambezi River flows at Victoria Falls have been decreasing due to reduced rainfall activity and inflow from the upper Kariba Catchment, closing the period under review at 3,337m3/s on 29th March 2021. The flow observed on the same date last year was 4,187m3/s.

DateFlow (m3/s) 2020/21Flow (m3/s) 2019/20
16/3/20213,5312,146
17/3/20213,5002,284
18/3/20213,4832,398
19/3/20213,4532,520
20/3/20213,4532,647
21/3/20213,4382,797
22/3/20213,4052,962
23/3/20213,3903,133
24/3/20213,3603,364
25/3/20213,3503,582
26/3/20213,3473,730
27/3/20213,3403,890
28/3/20213,3404,053
29/3/20213,3374,187
From: 
Tuesday, March 16, 2021
To: 
Monday, March 29, 2021
Lake Levels Graphic: 
vic-falls

Chavuma

The Zambezi River flows at Chavuma are increasing steadily again, closing the period under review at 3,113m3/s as of 7th April 2026, whilst last year on the same date it was at 3,312m3/s.

From:
25 March 2026
To:
7 April 2026
DateFlow (m3/s)(2024/25)Flow (m3/s)(2023/24)
25-Mar2,8642,731
26-Mar2,7682,697
27-Mar2,8462,632
28-Mar2,9132,584
29-Mar2,9292,570
30-Mar2,9222,554
31-Mar3,0172,548
1-Apr3,0542,607
2-Apr3,0222,696
3-Apr2,9782,796
4-Apr2,9622,964
5-Apr2,9573,010
6-Apr3,0443,106
7-Apr3,1133,312

Ngonye

Flows at Ngonye are steadily decreasing, closing the period under review at 4,009m3/s as of 7th April 2026. The flow recorded last year on the same date was lower at 2,337m3/s.

From:
25 March 2026
To:
7 April 2026
DateFlow (m3/s)(2024/25)Flow (m3/s)(2023/24)
25-Mar4,2532,237
26-Mar4,2342,239
27-Mar4,2262,246
28-Mar4,2232,257
29-Mar4,2012,261
30-Mar4,1992,261
31-Mar4,1822,263
1-Apr4,1792,268
2-Apr4,1522,268
3-Apr4,1392,281
4-Apr4,1172,283
5-Apr4,1122,299
6-Apr4,0602,324
7-Apr4,0092,337

Victoria Falls (Nana’s Farm Station)

The Zambezi River flows at Victoria Falls – Nana’s Farm Station are increasing as rainfall season progresses, with fluctuations being observed in the flows, closing the period under review at 4,136m3/s as of 7th April 2026.  The flow observed on the same date last year was lower at 1,983m3/s.

From:
25 March 2026
To:
7 April 2026
DateFlow (m3/s)(2024/25)Flow (m3/s)(2023/24)
25-Mar4,1521,325
26-Mar4,1651,385
27-Mar4,1871,447
28-Mar4,1921,519
29-Mar4,2001,586
30-Mar4,2061,647
31-Mar4,1951,718
1-Apr4,2001,776
2-Apr4,1601,822
3-Apr4,1311,872
4-Apr4,1041,909
5-Apr4,1151,946
6-Apr4,1331,967
7-Apr4,1361,983