Hydrology Banner

Victoria Falls / Big Tree

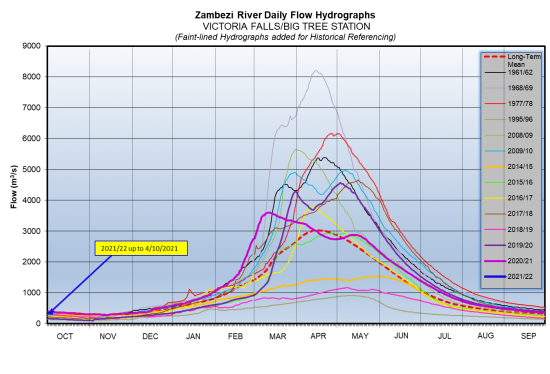
The Zambezi River flows at Victoria Falls are in recession, closing the period under review at 336m3/s on 4th October 2021. The flow observed on the same date last year was 379m3/s.

DateFlow (m3/s)(2020/21)Flow (m3/s)(2019/20)
21/9/21385422
22/9/21384419
23/9/21377414
24/9/21374411
25/9/21370405
26/9/21365405
27/9/21360404
28/9/21356403
29/9/21353398
30/9/21351395
1/10/2021344391
2/10/2021341386
3/10/2021338381
4/10/2021336379
From: 
Tuesday, September 21, 2021
To: 
Monday, October 4, 2021
Lake Levels Graphic: 
vic-falls

Chavuma

The Zambezi River flows at Chavuma are decreasing steadily, closing the period under review at 2,584m3/s as of 5th May 2025, whilst last year on the same date it was much lower at 774m3/s.

From:
29 April 2025
To:
5 May 2025
DateFlow (m3/s)(2024/25)Flow (m3/s)(2023/24)
29-Apr3,065916
30-Apr3,103891
1-May3,074870
2-May2,971843
3-May2,842821
4-May2,695799
5-May2,584774
chavuma

Ngonye

Flows at Ngonye peaked to 3,014m3/s on 2nd May 2025, before decreasing steadily, closing the period under review at 2,982m3/s as of 5th May 2025. The flow recorded last year on the same date was lower at 880m3/s.

From:
29 April 2025
To:
5 May 2025
DateFlow (m3/s)(2024/25)Flow (m3/s)(2023/24)
29-Apr2,970834
30-Apr2,999839
1-May3,009852
2-May3,014860
3-May3,009867
4-May2,987877
5-May2,982880
ngonye

Victoria Falls (Nana’s Farm Station)

The Zambezi River flows at Victoria Falls – Nana’s Farm Station are increasing steadily, closing the period under review at 2,635m3/s on 5th May 2025.  The flow observed on the same date last year was lower at 735m3/s.

From:
29 April 2025
To:
5 May 2025
DateFlow (m3/s)(2024/25)Flow (m3/s)(2023/24)
29-Apr2,498711
30-Apr2,514716
1-May2,539723
2-May2,559726
3-May2,582724
4-May2,612729
5-May2,635735
vicfalls