Hydrology Banner

Victoria Falls / Big Tree

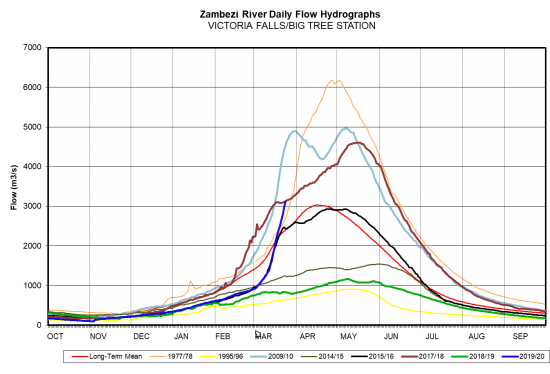
Flows at Victoria Falls have continued to increase steadily during the period under review before closing at 3,133m3/s on 23rd March 2020. Last year on the same date, the flow was 831m3/s. The Zambezi River flows at Victoria Falls are above the long-term mean.

DateFlow (m3/s) 2020Flow (m3/s) 2019
10/3/20201328824
11/3/20201382816
12/3/20201507824
13/3/20201630831
14/3/20201800839
15/3/20201975831
16/3/20202146824
17/3/20202284824
18/3/20202398808
19/3/20202520800
20/3/20202647808
21/3/20202797839
22/3/20202962839
23/3/20203133831
From: 
Tuesday, March 10, 2020
To: 
Monday, March 23, 2020
Lake Levels Graphic: 
vic falls

Chavuma

The Zambezi River flows at Chavuma are decreasing steadily, closing the period under review at 2,584m3/s as of 5th May 2025, whilst last year on the same date it was much lower at 774m3/s.

From:
29 April 2025
To:
5 May 2025
DateFlow (m3/s)(2024/25)Flow (m3/s)(2023/24)
29-Apr3,065916
30-Apr3,103891
1-May3,074870
2-May2,971843
3-May2,842821
4-May2,695799
5-May2,584774
chavuma

Ngonye

Flows at Ngonye peaked to 3,014m3/s on 2nd May 2025, before decreasing steadily, closing the period under review at 2,982m3/s as of 5th May 2025. The flow recorded last year on the same date was lower at 880m3/s.

From:
29 April 2025
To:
5 May 2025
DateFlow (m3/s)(2024/25)Flow (m3/s)(2023/24)
29-Apr2,970834
30-Apr2,999839
1-May3,009852
2-May3,014860
3-May3,009867
4-May2,987877
5-May2,982880
ngonye

Victoria Falls (Nana’s Farm Station)

The Zambezi River flows at Victoria Falls – Nana’s Farm Station are increasing steadily, closing the period under review at 2,635m3/s on 5th May 2025.  The flow observed on the same date last year was lower at 735m3/s.

From:
29 April 2025
To:
5 May 2025
DateFlow (m3/s)(2024/25)Flow (m3/s)(2023/24)
29-Apr2,498711
30-Apr2,514716
1-May2,539723
2-May2,559726
3-May2,582724
4-May2,612729
5-May2,635735
vicfalls