Hydrology Banner

Victoria Falls / Big Tree

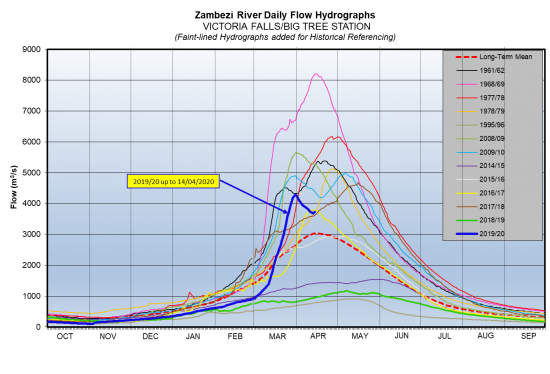
Flows at Victoria Falls have started increasing again as the second flood wave arrives, closing the period under review at 3,730m3/s on 14th April 2020. The flow observed on the same date last year was 946m3/s.

DateFlow (m3/s) 2020Flow (m3/s) 2019
1/4/20204255824
2/4/20204153831
3/4/20204086839
4/4/20204020847
5/4/20203954855
6/4/20203922863
7/4/20203890871
8/4/20203857888
9/4/20203825896
10/4/20203762904
11/4/20203730921
12/4/20203699929
13/4/20203683938
14/4/20203730946
From: 
Wednesday, April 1, 2020
To: 
Tuesday, April 14, 2020
Lake Levels Graphic: 
vic falls

Chavuma

The Zambezi River flows at Chavuma are decreasing steadily, closing the period under review at 2,584m3/s as of 5th May 2025, whilst last year on the same date it was much lower at 774m3/s.

From:
29 April 2025
To:
5 May 2025
DateFlow (m3/s)(2024/25)Flow (m3/s)(2023/24)
29-Apr3,065916
30-Apr3,103891
1-May3,074870
2-May2,971843
3-May2,842821
4-May2,695799
5-May2,584774
chavuma

Ngonye

Flows at Ngonye peaked to 3,014m3/s on 2nd May 2025, before decreasing steadily, closing the period under review at 2,982m3/s as of 5th May 2025. The flow recorded last year on the same date was lower at 880m3/s.

From:
29 April 2025
To:
5 May 2025
DateFlow (m3/s)(2024/25)Flow (m3/s)(2023/24)
29-Apr2,970834
30-Apr2,999839
1-May3,009852
2-May3,014860
3-May3,009867
4-May2,987877
5-May2,982880
ngonye

Victoria Falls (Nana’s Farm Station)

The Zambezi River flows at Victoria Falls – Nana’s Farm Station are increasing steadily, closing the period under review at 2,635m3/s on 5th May 2025.  The flow observed on the same date last year was lower at 735m3/s.

From:
29 April 2025
To:
5 May 2025
DateFlow (m3/s)(2024/25)Flow (m3/s)(2023/24)
29-Apr2,498711
30-Apr2,514716
1-May2,539723
2-May2,559726
3-May2,582724
4-May2,612729
5-May2,635735
vicfalls