Hydrology Banner

Victoria Falls / Big Tree

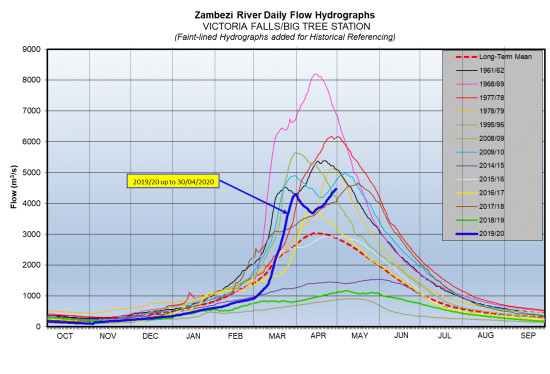
Flows at Victoria Falls are increasing again as the second flood wave arrives, closing the period under review at 4,462m3/s on 30th April 2020. The flow observed on the same date last year was 1,108m3/s.

DateFlow (m3/s) 2020Flow (m3/s) 2019
17/4/20203857981
18/4/20203873989
19/4/20203890998
20/4/202039221007
21/4/202039541025
22/4/202040051025
23/4/202040861034
24/4/202041531061
25/4/202042061070
26/4/202042521080
27/4/202043581089
28/4/202043751098
29/4/202044271098
30/4/202044621108
From: 
Friday, April 17, 2020
To: 
Thursday, April 30, 2020
Lake Levels Graphic: 
vic falls

Chavuma

The Zambezi River flows at Chavuma are decreasing steadily, closing the period under review at 2,584m3/s as of 5th May 2025, whilst last year on the same date it was much lower at 774m3/s.

From:
29 April 2025
To:
5 May 2025
DateFlow (m3/s)(2024/25)Flow (m3/s)(2023/24)
29-Apr3,065916
30-Apr3,103891
1-May3,074870
2-May2,971843
3-May2,842821
4-May2,695799
5-May2,584774
chavuma

Ngonye

Flows at Ngonye peaked to 3,014m3/s on 2nd May 2025, before decreasing steadily, closing the period under review at 2,982m3/s as of 5th May 2025. The flow recorded last year on the same date was lower at 880m3/s.

From:
29 April 2025
To:
5 May 2025
DateFlow (m3/s)(2024/25)Flow (m3/s)(2023/24)
29-Apr2,970834
30-Apr2,999839
1-May3,009852
2-May3,014860
3-May3,009867
4-May2,987877
5-May2,982880
ngonye

Victoria Falls (Nana’s Farm Station)

The Zambezi River flows at Victoria Falls – Nana’s Farm Station are increasing steadily, closing the period under review at 2,635m3/s on 5th May 2025.  The flow observed on the same date last year was lower at 735m3/s.

From:
29 April 2025
To:
5 May 2025
DateFlow (m3/s)(2024/25)Flow (m3/s)(2023/24)
29-Apr2,498711
30-Apr2,514716
1-May2,539723
2-May2,559726
3-May2,582724
4-May2,612729
5-May2,635735
vicfalls