Hydrology Banner

Victoria Falls / Big Tree

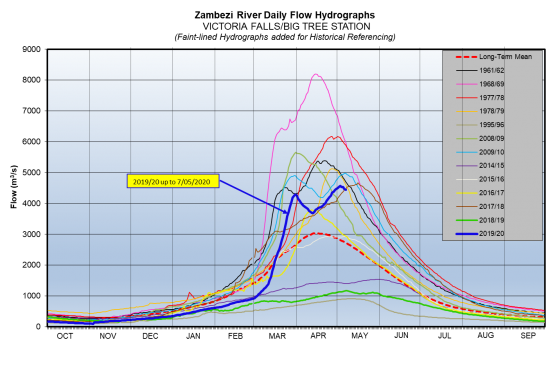
The second Zambezi River flood peak (5,825 m3/s ) recorded at Chavuma on 6th April 2020 arrived at Victoria Falls some 27 days later on 3rd May 2020, with a subdued magnitude of 4,568 m3/s before dropping to 4,444m3/s on 7th May 2020. The flow observed on the same date last year was 1,165m3/s. (NB: the variation in timing of the peak flood between Victoria Falls and Nana’s Farm upstream is attributable to a potential gauge shift that will have to be corrected after the flood season).

DateFlow (m3/s) 2020Flow (m3/s) 2019
24/4/202041531061
25/4/202042061070
26/4/202042521080
27/4/202043581089
28/4/202043751098
29/4/202044271098
30/4/202044621108
1/5/202044971117
2/5/202045321127
3/5/202045681136
4/5/202045321136
5/5/202045321146
6/5/202044621156
7/5/202044441165
From: 
Friday, April 24, 2020
To: 
Thursday, May 7, 2020
Lake Levels Graphic: 
vic-falls

Chavuma

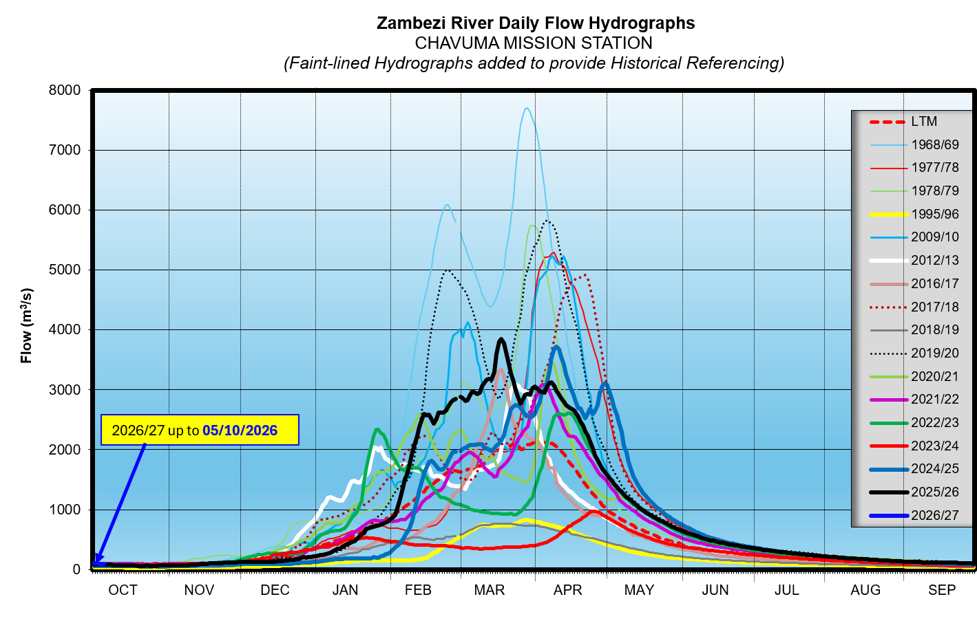
The Zambezi River flows at Chavuma are in recession, closing the period under review at 169m3/s as of 17th August 2026, whilst last year on the same date it was at 165m3/s. 

From:
4 August 2026
To:
17 August 2026
DateFlow (m3/s)(2025/26)Flow (m3/s)(2024/25)
4-Aug204203
5-Aug202201
6-Aug199199
7-Aug196196
8-Aug191192
9-Aug189189
10-Aug186186
11-Aug183183
12-Aug181180
13-Aug177176
14-Aug175173
15-Aug173170
16-Aug171168
17-Aug169165

Ngonye

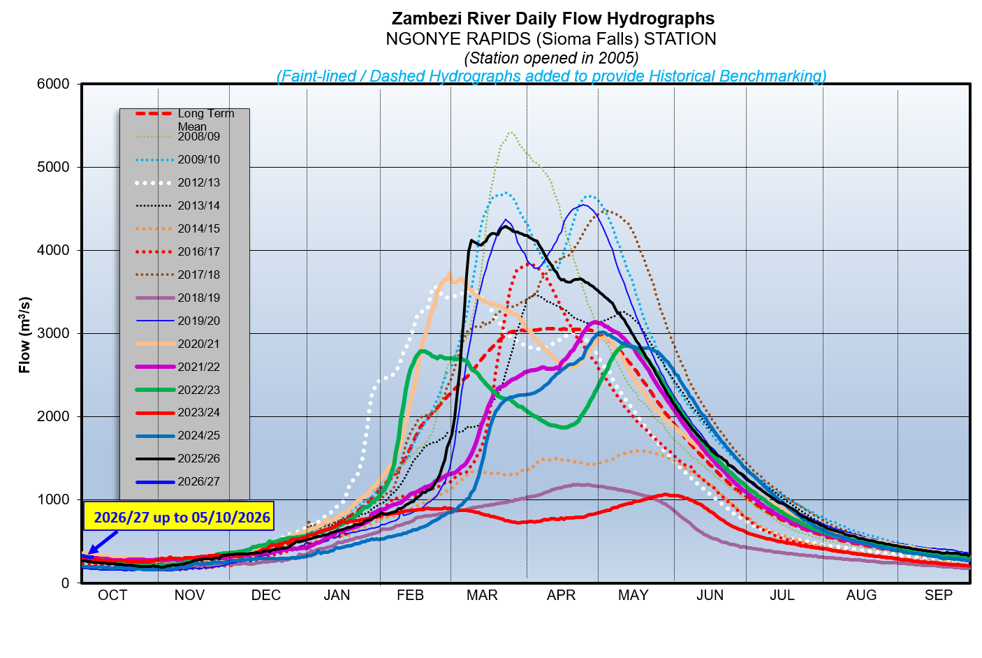
Flows at Ngonye are steadily decreasing, closing the period under review at 535m3/s as of 17th August 2026. The flow recorded last year on the same date was at 487m3/s.

From:
4 August 2026
To:
17 August 2026
DateFlow (m3/s)(2025/26)Flow (m3/s)(2024/25)
4-Aug649599
5-Aug635590
6-Aug631577
7-Aug618570
8-Aug609555
9-Aug600545
10-Aug590539
11-Aug577532
12-Aug569527
13-Aug566516
14-Aug557510
15-Aug548500
16-Aug539494
17-Aug535487

Victoria Falls (Nana’s Farm Station)

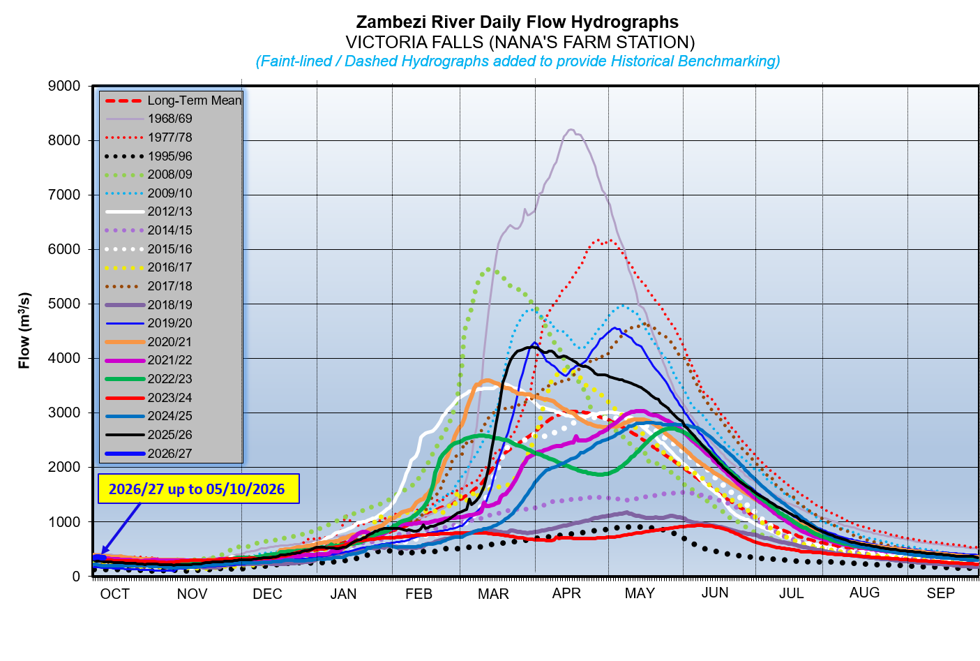
The Zambezi River flows at Victoria Falls – Nana’s Farm Station are steadily decreasing, closing the period under review at 564m3/s as of 17th August 2026.  The flow observed on the same date last year was at 513m3/s.

From:
4 August 2026
To:
17 August 2026
DateFlow (m3/s)(2025/26)Flow (m3/s)(2024/25)
4-Aug703665
5-Aug691648
6-Aug674626
7-Aug661616
8-Aug641606
9-Aug631594
10-Aug624581
11-Aug613570
12-Aug601562
13-Aug590550
14-Aug582540
15-Aug578530
16-Aug570519
17-Aug564513