Hydrology Banner

Victoria Falls / Big Tree

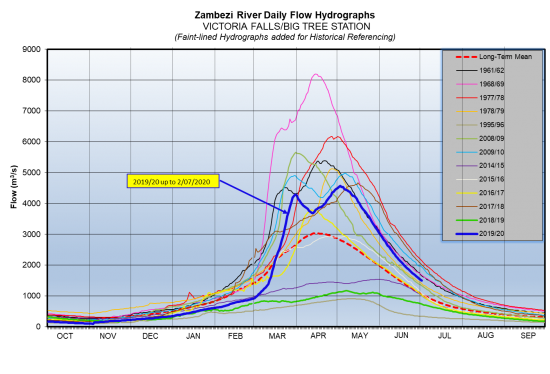
The Zambezi River flows at Victoria Falls are in recession, closing the period under review at 1,500 m3/s on 2nd July 2020. The flow observed on the same date last year was 733m3/s.

DateFlow (m3/s) 2020Flow (m3/s) 2019
19/6/20201994871
20/6/20201948855
21/6/20201909839
22/6/20201868831
23/6/20201830824
24/6/20201784808
25/6/20201746800
26/6/20201712793
27/6/20201673785
28/6/20201638778
29/6/20201601770
30/6/20201564763
1/7/20201528748
2/7/20201500733
From: 
Saturday, June 20, 2020
To: 
Thursday, July 2, 2020
Lake Levels Graphic: 
vic-falls

Chavuma

The Zambezi River flows at Chavuma are decreasing steadily, closing the period under review at 2,584m3/s as of 5th May 2025, whilst last year on the same date it was much lower at 774m3/s.

From:
29 April 2025
To:
5 May 2025
DateFlow (m3/s)(2024/25)Flow (m3/s)(2023/24)
29-Apr3,065916
30-Apr3,103891
1-May3,074870
2-May2,971843
3-May2,842821
4-May2,695799
5-May2,584774
chavuma

Ngonye

Flows at Ngonye peaked to 3,014m3/s on 2nd May 2025, before decreasing steadily, closing the period under review at 2,982m3/s as of 5th May 2025. The flow recorded last year on the same date was lower at 880m3/s.

From:
29 April 2025
To:
5 May 2025
DateFlow (m3/s)(2024/25)Flow (m3/s)(2023/24)
29-Apr2,970834
30-Apr2,999839
1-May3,009852
2-May3,014860
3-May3,009867
4-May2,987877
5-May2,982880
ngonye

Victoria Falls (Nana’s Farm Station)

The Zambezi River flows at Victoria Falls – Nana’s Farm Station are increasing steadily, closing the period under review at 2,635m3/s on 5th May 2025.  The flow observed on the same date last year was lower at 735m3/s.

From:
29 April 2025
To:
5 May 2025
DateFlow (m3/s)(2024/25)Flow (m3/s)(2023/24)
29-Apr2,498711
30-Apr2,514716
1-May2,539723
2-May2,559726
3-May2,582724
4-May2,612729
5-May2,635735
vicfalls