Hydrology Banner

Victoria Falls/Big Tree

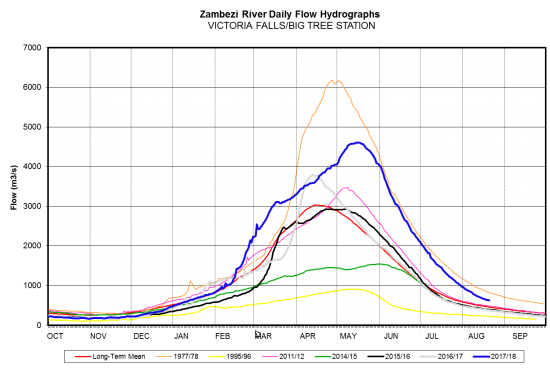
Flows at Victoria Falls have been decreasing closing the week under review at 623m3/s on 20th August 2018. Last year on the same date, the flow was 377m3/s.  

Date Flow(m3/s)
14/08/2018691
15/08/2018677
16/08/2018663
17/08/2018650
18/08/2018636
19/08/2018630
20/08/2018623
From: 
Tuesday, August 14, 2018
To: 
Monday, August 20, 2018
Lake Levels Graphic: 
Victoria Falls/Big Tree

Chavuma

The Zambezi River flows at Chavuma are rising steadily, with records of fluctuations being observed due to the influence of local rainfall activity, closing the period under review at 112m3/s as of 25th November 2025, whilst last year on the same date it was lower at 77m3/s.


From:
12 November 2025
To:
25 November 2025
DateFlow (m3/s)(2024/25)Flow (m3/s)(2023/24)
12-Nov8464
13-Nov8769
14-Nov9271
15-Nov9472
16-Nov9772
17-Nov9872
18-Nov10272
19-Nov10673
20-Nov10873
21-Nov11174
22-Nov10974
23-Nov11175
24-Nov11375
25-Nov11277

Ngonye

Flows at Ngonye are increasing with records of fluctuation being observed due to local rainfall activity, closing the period under review at 303m3/s as of 25th November 2025. The flow recorded last year on the same date was lower at 247m3/s.

From:
12 November 2025
To:
25 November 2025
DateFlow (m3/s)(2024/25)Flow (m3/s)(2023/24)
12-Nov238191
13-Nov241198
14-Nov253202
15-Nov257222
16-Nov274235
17-Nov276236
18-Nov282229
19-Nov286227
20-Nov288230
21-Nov292235
22-Nov292235
23-Nov283240
24-Nov299267
25-Nov303247

Victoria Falls (Nana’s Farm Station)

Flows at Ngonye are increasing with records of fluctuation being observed due to local rainfall activity, closing the period under review at 303m3/s as of 25th November 2025. The flow recorded last year on the same date was lower at 247m3/s.

From:
12 November 2025
To:
25 November 2025
DateFlow (m3/s)(2024/25)Flow (m3/s)(2023/24)
12-Nov238191
13-Nov241198
14-Nov253202
15-Nov257222
16-Nov274235
17-Nov276236
18-Nov282229
19-Nov286227
20-Nov288230
21-Nov292235
22-Nov292235
23-Nov283240
24-Nov299267
25-Nov303247