Hydrology Banner

Victoria Falls/Big Tree

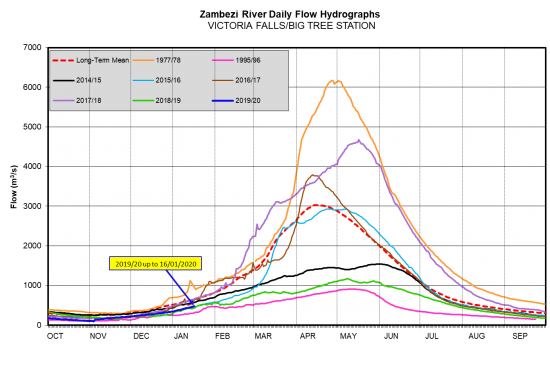
Flows at Victoria Falls have continued to increase steadily during the period under review before closing at 479m3/s on 16th January 2020. Last year on the same date, the flow was 436m3/s.

DateFlow (m3/s) (2020)Flow (m3/s) (2019)
3/1/2020368349
4/1/2020377358
5/1/2020382354
6/1/2020386349
7/1/2020396377
8/1/2020406386
9/1/2020416401
10/1/2020426406
11/1/2020431436
12/1/2020436426
13/1/2020447421
14/1/2020457416
15/1/2020468426
16/1/2020479436
From: 
Friday, January 3, 2020
To: 
Thursday, January 16, 2020
Lake Levels Graphic: 
Victoria Falls/Big Tree

Chavuma

The Zambezi River flows at Chavuma are decreasing steadily, closing the period under review at 2,584m3/s as of 5th May 2025, whilst last year on the same date it was much lower at 774m3/s.

From:
29 April 2025
To:
5 May 2025
DateFlow (m3/s)(2024/25)Flow (m3/s)(2023/24)
29-Apr3,065916
30-Apr3,103891
1-May3,074870
2-May2,971843
3-May2,842821
4-May2,695799
5-May2,584774
chavuma

Ngonye

Flows at Ngonye peaked to 3,014m3/s on 2nd May 2025, before decreasing steadily, closing the period under review at 2,982m3/s as of 5th May 2025. The flow recorded last year on the same date was lower at 880m3/s.

From:
29 April 2025
To:
5 May 2025
DateFlow (m3/s)(2024/25)Flow (m3/s)(2023/24)
29-Apr2,970834
30-Apr2,999839
1-May3,009852
2-May3,014860
3-May3,009867
4-May2,987877
5-May2,982880
ngonye

Victoria Falls (Nana’s Farm Station)

The Zambezi River flows at Victoria Falls – Nana’s Farm Station are increasing steadily, closing the period under review at 2,635m3/s on 5th May 2025.  The flow observed on the same date last year was lower at 735m3/s.

From:
29 April 2025
To:
5 May 2025
DateFlow (m3/s)(2024/25)Flow (m3/s)(2023/24)
29-Apr2,498711
30-Apr2,514716
1-May2,539723
2-May2,559726
3-May2,582724
4-May2,612729
5-May2,635735
vicfalls