Hydrology Banner

Victoria Falls/Big Tree

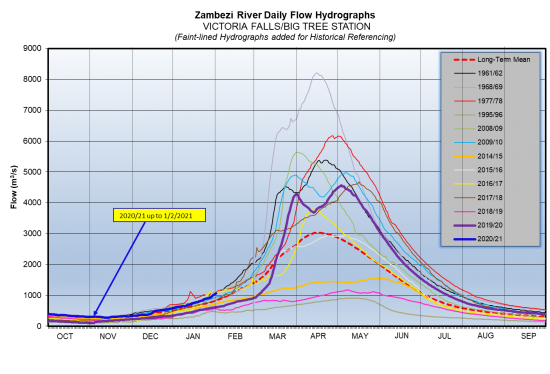
The Zambezi River flows at Victoria Falls have continued increasing steadily due to local rainfall activity and increasing inflow from the Upper Catchment, closing the period under review at 1,061 m3/s on 1st February 2021. The flow observed on the same date last year was 617 m3/s.

Date20212020
19/1/2021793513
20/1/2021808524
21/1/2021824530
22/1/2021839536
23/1/2021871548
24/1/2021888560
25/1/2021896566
26/1/2021904573
27/1/2021921585
28/1/2021929591
29/1/2021972598
30/1/20211,014604
31/1/20211,032610
1/2/20211,061617
From: 
Tuesday, January 19, 2021
To: 
Monday, February 1, 2021
Lake Levels Graphic: 
vic falls

Chavuma

The Zambezi River flows at Chavuma are decreasing steadily, closing the period under review at 2,584m3/s as of 5th May 2025, whilst last year on the same date it was much lower at 774m3/s.

From:
29 April 2025
To:
5 May 2025
DateFlow (m3/s)(2024/25)Flow (m3/s)(2023/24)
29-Apr3,065916
30-Apr3,103891
1-May3,074870
2-May2,971843
3-May2,842821
4-May2,695799
5-May2,584774
chavuma

Ngonye

Flows at Ngonye peaked to 3,014m3/s on 2nd May 2025, before decreasing steadily, closing the period under review at 2,982m3/s as of 5th May 2025. The flow recorded last year on the same date was lower at 880m3/s.

From:
29 April 2025
To:
5 May 2025
DateFlow (m3/s)(2024/25)Flow (m3/s)(2023/24)
29-Apr2,970834
30-Apr2,999839
1-May3,009852
2-May3,014860
3-May3,009867
4-May2,987877
5-May2,982880
ngonye

Victoria Falls (Nana’s Farm Station)

The Zambezi River flows at Victoria Falls – Nana’s Farm Station are increasing steadily, closing the period under review at 2,635m3/s on 5th May 2025.  The flow observed on the same date last year was lower at 735m3/s.

From:
29 April 2025
To:
5 May 2025
DateFlow (m3/s)(2024/25)Flow (m3/s)(2023/24)
29-Apr2,498711
30-Apr2,514716
1-May2,539723
2-May2,559726
3-May2,582724
4-May2,612729
5-May2,635735
vicfalls