Hydrology Banner

Victoria Falls/Big Tree

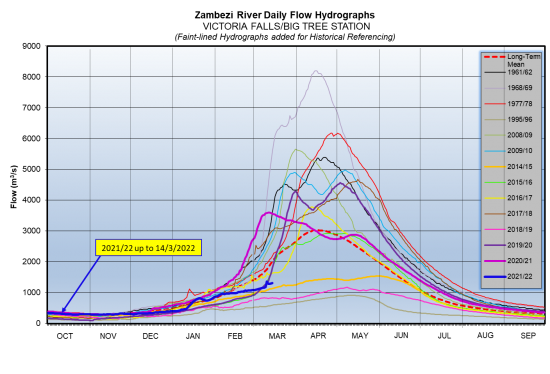
The Zambezi River flows at Victoria Falls have been increasing steadily due to the influence of local rainfall activity, closing the period under review at 1,314m3/s on 14th March 2022. The flow observed on the same date last year was 3,559m3/s.

DateFlow (m3/s)(2021/22)Flow (m3/s)(2020/21)
3/1/20221,0912,831
3/2/20221,0992,965
3/3/20221,1163,102
3/4/20221,1233,243
3/5/20221,1303,352
3/6/20221,1433,453
3/7/20221,1573,493
3/8/20221,1623,508
3/9/20221,1863,569
3/10/20221,3593,584
3/11/20221,2893,597
3/12/20221,2903,597
3/13/20221,3013,579
3/14/20221,3143,559
From: 
Tuesday, March 1, 2022
To: 
Monday, March 14, 2022
Lake Levels Graphic: 
vic falls

Chavuma

The Zambezi River flows at Chavuma are rising steadily as the rainfall season progresses, closing the period under review at 723m3/s as of 26th January 2026, whilst last year on the same date it was lower at 197m3/s.

From:
13 January 2026
To:
26 January 2026
DateFlow (m3/s)(2024/25)Flow (m3/s)(2023/24)
13-Jan399180
14-Jan428182
15-Jan443183
16-Jan465182
17-Jan475181
18-Jan511181
19-Jan557183
20-Jan585186
21-Jan613186
22-Jan677184
23-Jan688186
24-Jan704192
25-Jan713210
26-Jan723197

Ngonye

Flows at Ngonye are increasing with records of fluctuation being observed due to the influence of local rainfall activity, closing the period under review at 754m3/s as of 26th January 2026. The flow recorded last year on the same date was lower at 516m3/s.

From:
13 January 2026
To:
26 January 2026
DateFlow (m3/s)(2024/25)Flow (m3/s)(2023/24)
13-Jan616421
14-Jan626422
15-Jan638425
16-Jan641431
17-Jan650436
18-Jan668444
19-Jan674450
20-Jan675457
21-Jan706471
22-Jan703472
23-Jan707483
24-Jan716500
25-Jan749502
26-Jan754516

Victoria Falls (Nana’s Farm Station)

From:
13 January 2026
To:
26 January 2026
DateFlow (m3/s)(2024/25)Flow (m3/s)(2023/24)
13-Jan542378
14-Jan563397
15-Jan605401
16-Jan627415
17-Jan651420
18-Jan658431
19-Jan674441
20-Jan697458
21-Jan717466
22-Jan748527
23-Jan775517
24-Jan790538
25-Jan828547
26-Jan829547