Hydrology Banner

Victoria Falls/Big Tree

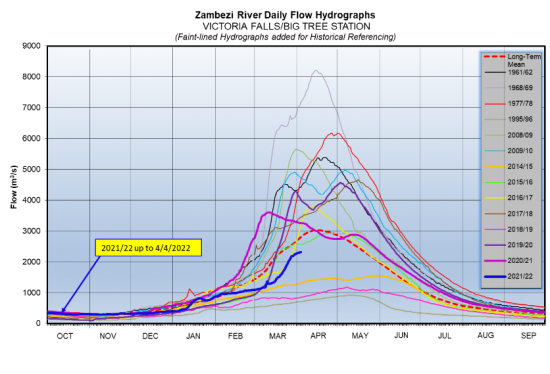
The Zambezi River flows at Victoria Falls have continued increasing, closing the period under review at 2,310m3/s on 4th April 2022. The flow observed on the same date last year was 3,253m3/s.

DateFlow (m3/s)(2021/22)Flow (m3/s)(2020/21)
3/22/20221,6903,405
3/23/20221,7643,390
3/24/20221,8463,360
3/25/20221,9403,350
3/26/20222,0293,347
3/27/20222,0993,340
3/28/20222,1733,340
3/29/20222,1953,337
3/30/20222,2253,308
3/31/20222,2573,298
4/1/20222,2733,290
4/2/20222,2883,273
4/3/20222,2973,266
4/4/20222,3103,253
From: 
Tuesday, March 22, 2022
To: 
Monday, April 4, 2022
Lake Levels Graphic: 
vic falls

Chavuma

The Zambezi River flows at Chavuma are rising steadily as the rainfall season progresses, closing the period under review at 723m3/s as of 26th January 2026, whilst last year on the same date it was lower at 197m3/s.

From:
13 January 2026
To:
26 January 2026
DateFlow (m3/s)(2024/25)Flow (m3/s)(2023/24)
13-Jan399180
14-Jan428182
15-Jan443183
16-Jan465182
17-Jan475181
18-Jan511181
19-Jan557183
20-Jan585186
21-Jan613186
22-Jan677184
23-Jan688186
24-Jan704192
25-Jan713210
26-Jan723197

Ngonye

Flows at Ngonye are increasing with records of fluctuation being observed due to the influence of local rainfall activity, closing the period under review at 754m3/s as of 26th January 2026. The flow recorded last year on the same date was lower at 516m3/s.

From:
13 January 2026
To:
26 January 2026
DateFlow (m3/s)(2024/25)Flow (m3/s)(2023/24)
13-Jan616421
14-Jan626422
15-Jan638425
16-Jan641431
17-Jan650436
18-Jan668444
19-Jan674450
20-Jan675457
21-Jan706471
22-Jan703472
23-Jan707483
24-Jan716500
25-Jan749502
26-Jan754516

Victoria Falls (Nana’s Farm Station)

From:
13 January 2026
To:
26 January 2026
DateFlow (m3/s)(2024/25)Flow (m3/s)(2023/24)
13-Jan542378
14-Jan563397
15-Jan605401
16-Jan627415
17-Jan651420
18-Jan658431
19-Jan674441
20-Jan697458
21-Jan717466
22-Jan748527
23-Jan775517
24-Jan790538
25-Jan828547
26-Jan829547