Hydrology Banner

Victoria Falls/Big Tree

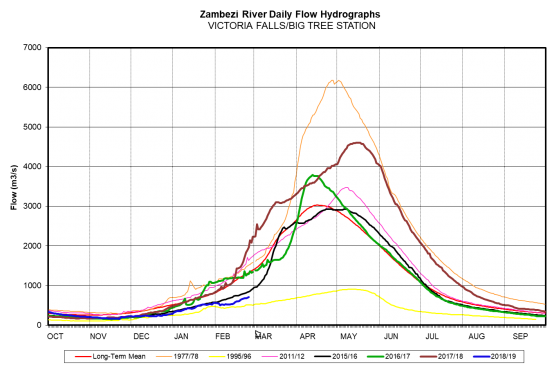
Flows at Victoria Falls have been increasing steadily due to localised rainfall activities around the catchment, closing the week under review at 705m3/s on 25th February 2019. Last year on the same date, the flow was 1,965m3/s.  

Date Flow(m3/s)
19/02/2019636
20/02/2019656
21/02/2019670
22/02/2019677
23/02/2019684
24/02/2019691
25/02/2019705
From: 
Tuesday, February 19, 2019
To: 
Monday, February 25, 2019
Lake Levels Graphic: 
Vic Falls

Chavuma

The Zambezi River flows at Chavuma are decreasing, closing the period under review at 870m3/s as of 27th May 2025, whilst last year on the same date it was much lower at 427m3/s.

From:
21 May 2025
To:
27 May 2025
DateFlow (m3/s)(2024/25)Flow (m3/s)(2023/24)
21-May1,062493
22-May1,026478
23-May996470
24-May963458
25-May925447
26-May894437
27-May870427
chavuma

Ngonye

Flows at Ngonye are decreasing steadily, closing the period under review at 2,713m3/s as of 27th May 2025. The flow recorded last year on the same date was lower at 1,059m3/s.

From:
21 May 2025
To:
27 May 2025
DateFlow (m3/s)(2024/25)Flow (m3/s)(2023/24)
21-May2,8351,021
22-May2,8081,029
23-May2,7991,036
24-May2,7851,043
25-May2,7731,048
26-May2,7421,052
27-May2,7131,059
ngonye

Victoria Falls (Nana’s Farm Station)

The Zambezi River flows at Victoria Falls – Nana’s Farm Station are decreasing steadily, closing the period under review at 2,790m3/s as of 27th May 2025.  The flow observed on the same date last year was lower at 893m3/s.

From:
21 May 2025
To:
27 May 2025
DateFlow (m3/s)(2024/25)Flow (m3/s)(2023/24)
21-May2,811854
22-May2,806860
23-May2,787865
24-May2,783874
25-May2,778881
26-May2,778887
27-May2,790893
vic-falls