Hydrology Banner

Victoria Falls

The Zambezi River flows at Victoria Falls continued decreasing, closing the period under review at 307m3/s on 29th October 2020. The flow observed on the same date last year was 107m3/s.

Date20202019
16-Oct-2020339134
17-Oct-2020334132
18-Oct-2020329129
19-Oct-2020325127
20-Oct-2020323125
21-Oct-2020320122
22-Oct-2020317120
23-Oct-2020317118
24-Oct-2020316116
25-Oct-2020315116
26-Oct-2020313113
27-Oct-2020312111
28-Oct-2020308109
29-Oct-2020307107
From: 
Friday, October 16, 2020
To: 
Thursday, October 29, 2020
Lake Levels Graphic: 

Chavuma

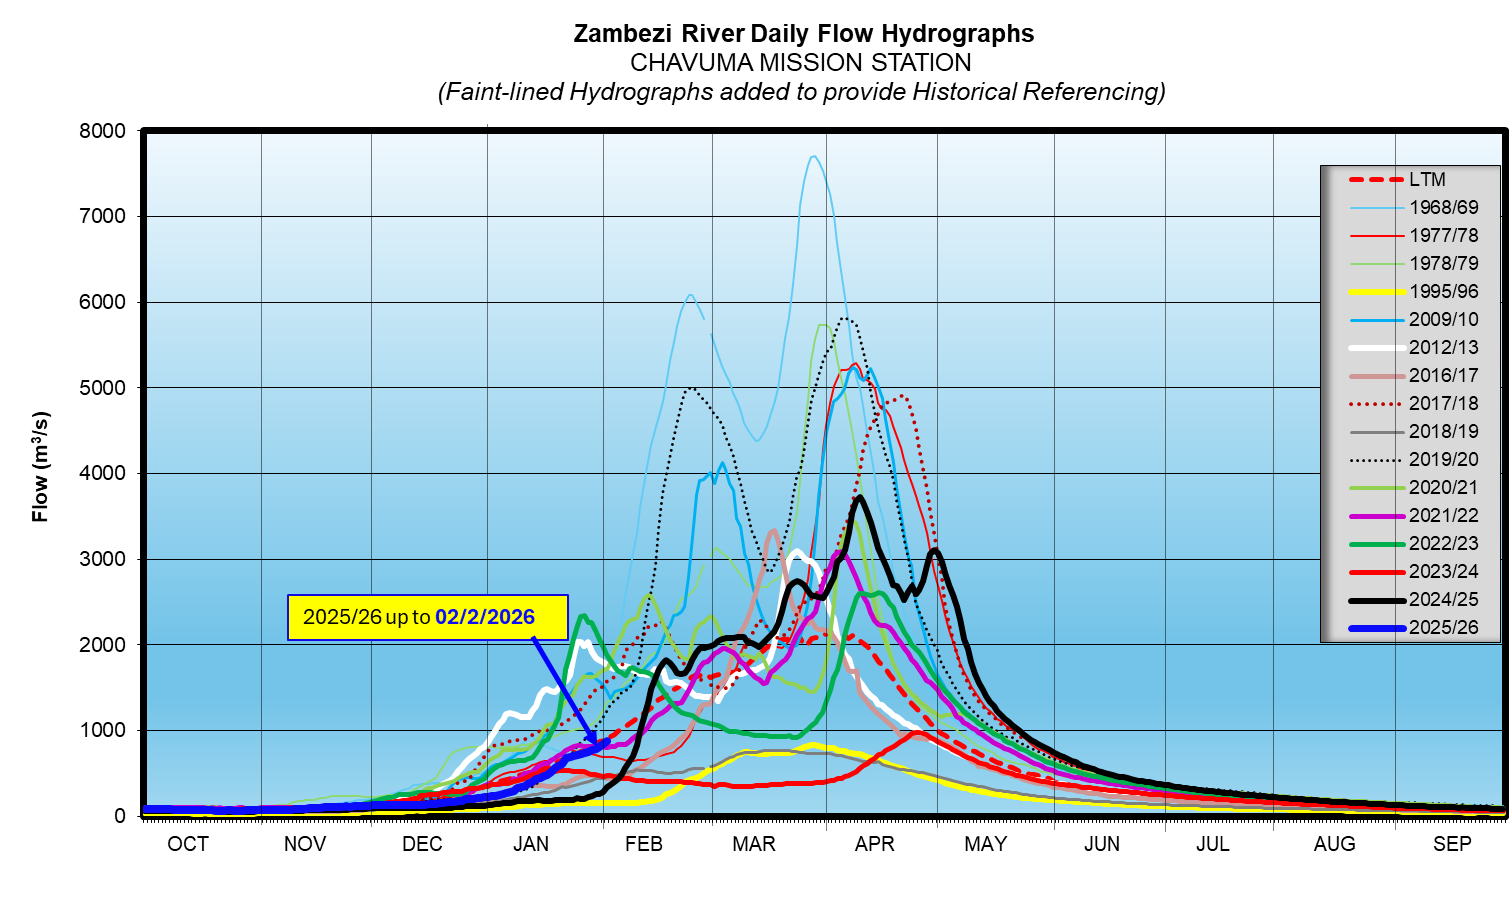
The Zambezi River flows at Chavuma are receding, closing the period under review at 207m3/s as of 5th August 2025, whilst last year on the same date it was lower at 146m3/s.

From:
23 July 2025
To:
5 August 2025
DateFlow (m3/s)(2024/25)Flow (m3/s)(2023/24)
23-Jul255176
24-Jul252173
25-Jul248171
26-Jul245169
27-Jul240167
28-Jul235164
29-Jul232161
30-Jul228159
31-Jul224157
1-Aug221154
2-Aug217151
3-Aug214149
4-Aug209147
5-Aug207146
chavuma

Ngonye

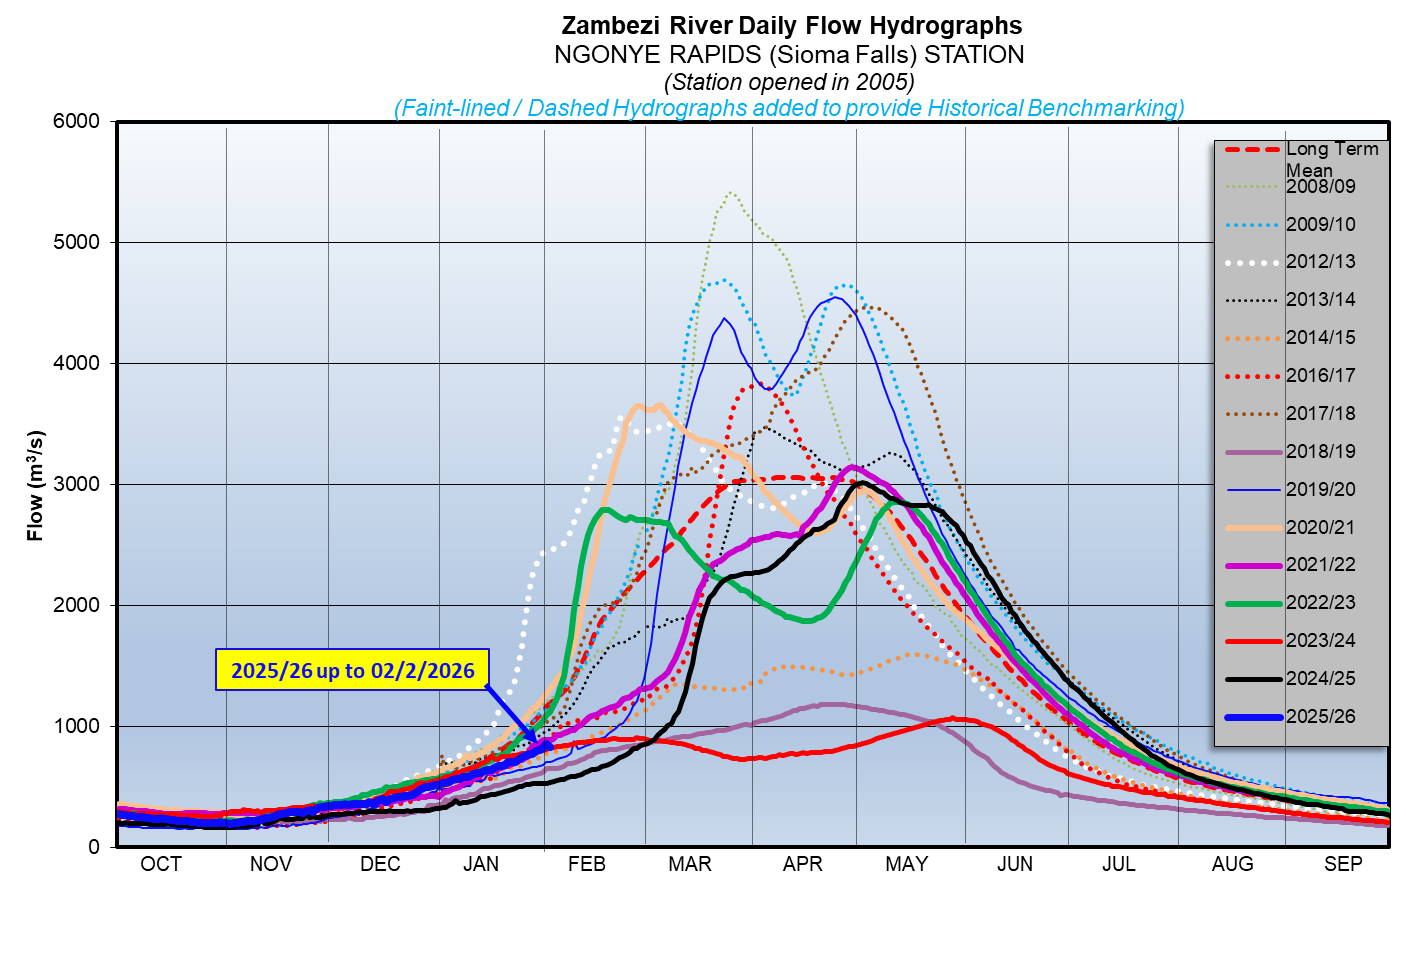
Flows at Ngonye are receding, closing the period under review at 590m3/s as of 5th August 2025. The flow recorded last year on the same date was lower at 390m3/s.

From:
23 July 2025
To:
5 August 2025
DateFlow (m3/s)(2024/25)Flow (m3/s)(2023/24)
23-Jul786451
24-Jul761448
25-Jul750440
26-Jul730436
27-Jul715435
28-Jul700431
29-Jul677421
30-Jul663421
31-Jul650418
1-Aug638413
2-Aug625411
3-Aug609402
4-Aug599395
5-Aug590390
ngonye

Victoria Falls (Nana’s Farm Station)

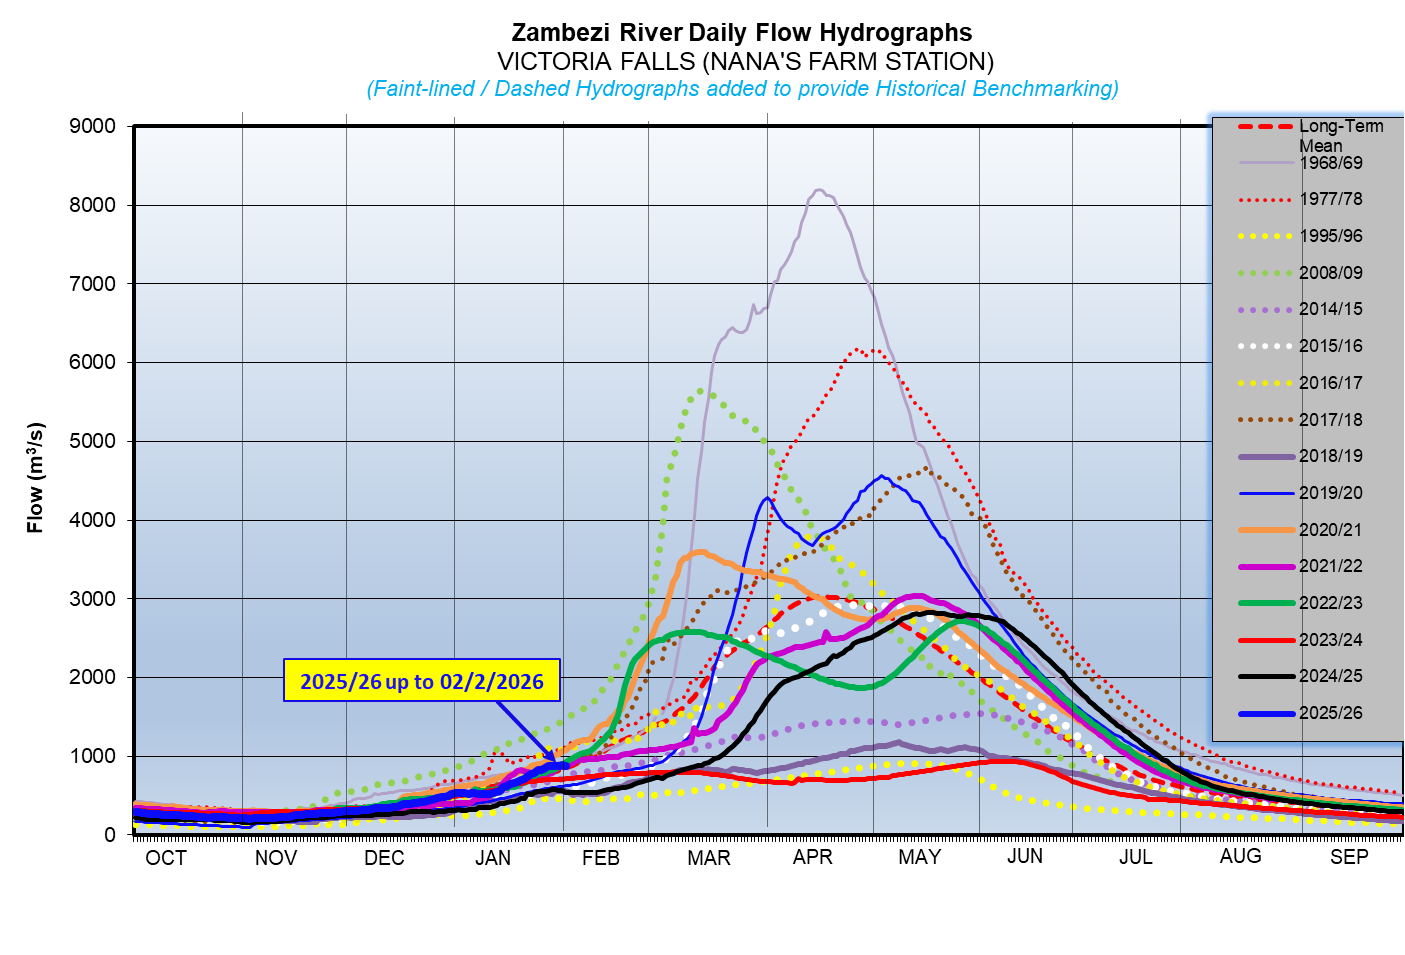
The Zambezi River flows at Victoria Falls – Nana’s Farm Station are in recession, closing the period under review at 648m3/s as of 5th August 2025.  The flow observed on the same date last year was lower at 397m3/s.

From:
23 July 2025
To:
5 August 2025
DateFlow (m3/s)(2024/25)Flow (m3/s)(2023/24)
23-Jul963448
24-Jul942446
25-Jul904443
26-Jul873441
27-Jul840437
28-Jul814433
29-Jul788430
30-Jul764420
31-Jul744417
1-Aug721413
2-Aug701407
3-Aug675404
4-Aug665401
5-Aug648397
vic-falls