Hydrology Banner

Victoria Falls / Big Tree

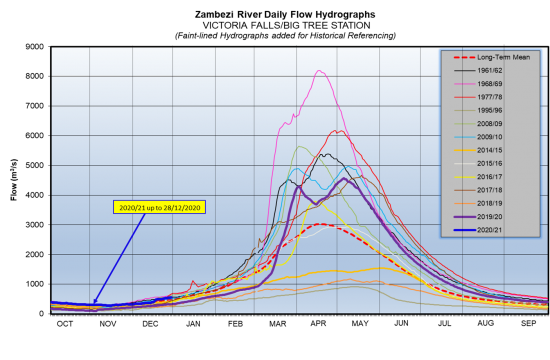
The Zambezi River flows at Victoria Falls have been increasing steadily due to local rainfall activity and inflow from the Upper Catchment, closing the period under review at 536 m3/s on 24th December 2020. The flow observed on the same date last year was 315m3/s.

Date20202019
15-Dec369270
16-Dec431274
17-Dec479274
18-Dec490282
19-Dec496290
20-Dec501294
21-Dec501298
22-Dec513302
23-Dec519306
24-Dec536315
25-Dec536323
26-Dec542319
27-Dec548323
28-Dec560327
From: 
Tuesday, December 15, 2020
To: 
Monday, December 28, 2020
Lake Levels Graphic: 

Chavuma

The Zambezi River flows at Chavuma are receding, closing the period under review at 150m3/s as of 25th August 2025, whilst last year on the same date it was lower at 106m3/s.

From:
12 August 2025
To:
25 August 2025
DateFlow (m3/s)(2024/25)Flow (m3/s)(2023/24)
12-Aug185132
13-Aug182130
14-Aug178127
15-Aug175126
16-Aug173124
17-Aug170121
18-Aug168120
19-Aug165118
20-Aug163115
21-Aug160113
22-Aug158112
23-Aug156110
24-Aug153107
25-Aug150106
chavuma

Ngonye

Flows at Ngonye are receding, closing the period under review at 431m3/s as of 25th August 2025. The flow recorded last year on the same date was lower at 311m3/s.

From:
12 August 2025
To:
25 August 2025
DateFlow (m3/s)(2024/25)Flow (m3/s)(2023/24)
12-Aug527363
13-Aug516359
14-Aug510356
15-Aug500351
16-Aug494347
17-Aug487346
18-Aug480340
19-Aug472337
20-Aug465332
21-Aug460329
22-Aug454323
23-Aug443323
24-Aug442318
25-Aug431311
ngonye

Victoria Falls (Nana’s Farm Station)

The Zambezi River flows at Victoria Falls – Nana’s Farm Station are in recession, closing the period under review at 456m3/s as of 25th August 2025.  The flow observed on the same date last year was lower at 328m3/s.

From:
12 August 2025
To:
25 August 2025
DateFlow (m3/s)(2024/25)Flow (m3/s)(2023/24)
12-Aug562374
13-Aug550369
14-Aug540367
15-Aug530362
16-Aug519357
17-Aug513354
18-Aug508351
19-Aug497347
20-Aug492345
21-Aug485341
22-Aug478338
23-Aug466335
24-Aug459331
25-Aug456328
vic-falls