Hydrology Banner

Victoria Falls / Big Tree

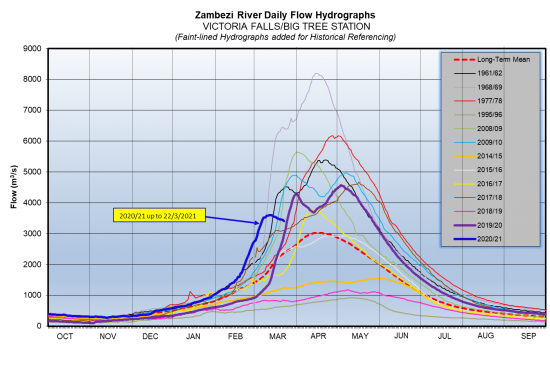
The Zambezi River flows at Victoria Falls peaked to 3,597 m3/s as of 11th and 12th of March 2021, before decreasing steadily due to reduced rainfall activity and inflow from the upper Kariba Catchment, closing the period under review at 3,405m3/s on 22nd March 2021. The flow observed on the same date last year was 2,962m3/s.

DateFlow (m3/s) 2020/21Flow (m3/s) 2019/20
9/3/20213,5691,276
10/3/20213,5841,328
11/3/20213,5971,382
12/3/20213,5971,507
13/3/20213,5901,630
14/3/20213,5591,800
15/3/20213,5441,975
16/3/20213,5312,146
17/3/20213,5002,284
18/3/20213,4832,398
19/3/20213,4532,520
20/3/20213,4532,647
21/3/20213,4382,797
22/3/20213,4052,962
From: 
Tuesday, March 9, 2021
To: 
Monday, March 22, 2021
Lake Levels Graphic: 
vic-falls

Chavuma

The Zambezi River flows at Chavuma are decreasing steadily, closing the period under review at 1,557m3/s as of 12th May 2025, whilst last year on the same date it was much lower at 631m3/s.

From:
6 May 2025
To:
12 May 2025
DateFlow (m3/s)(2024/25)Flow (m3/s)(2023/24)
6-May2,441750
7-May2,296729
8-May2,070706
9-May1,955686
10-May1,798667
11-May1,655648
12-May1,557631
chavuma

Ngonye

Flows at Ngonye are decreasing steadily, closing the period under review at 2,866m3/s as of 12th May 2025. The flow recorded last year on the same date was lower at 948m3/s.

From:
6 May 2025
To:
12 May 2025
DateFlow (m3/s)(2024/25)Flow (m3/s)(2023/24)
6-May2,960900
7-May2,941906
8-May2,929913
9-May2,912924
10-May2,883933
11-May2,880939
12-May2,866948
ngonye

Victoria Falls (Nana’s Farm Station)

The Zambezi River flows at Victoria Falls – Nana’s Farm Station are increasing steadily, closing the period under review at 2,804m3/s on 12th May 2025.  The flow observed on the same date last year was lower at 794m3/s.

From:
6 May 2025
To:
12 May 2025
DateFlow (m3/s)(2024/25)Flow (m3/s)(2023/24)
6-May2,658751
7-May2,690757
8-May2,706764
9-May2,752772
10-May2,759778
11-May2,773785
12-May2,804794
vic-falls