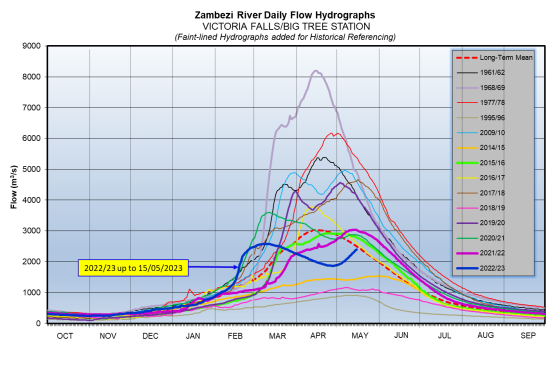
The Zambezi River flows at Victoria Falls are increasing again, closing the period under review at 2,400m3/s on 15th May 2023. The flow observed on the same date last year was 3,029m3/s.
|
Date |
Flow (m3/s) |
|
|
2022/23 |
2021/22 |
|
|
2-May |
1,917 |
2,776 |
|
3-May |
1,932 |
2,799 |
|
4-May |
1,954 |
2,837 |
|
5-May |
1,990 |
2,881 |
|
6-May |
2,023 |
2,917 |
|
7-May |
2,057 |
2,955 |
|
8-May |
2,095 |
2,984 |
|
9-May |
2,135 |
3,000 |
|
10-May |
2,182 |
3,017 |
|
11-May |
2,216 |
3,024 |
|
12-May |
2,266 |
3,032 |
|
13-May |
2,308 |
3,034 |
|
14-May |
2,356 |
3,034 |
|
15-May |
2,400 |
3,029 |
The Zambezi River flows at Victoria Falls are increasing again, closing the period under review at 2,400m3/s on 15th May 2023. The flow observed on the same date last year was 3,029m3/s.
| Date | Flow (m3/s)(2022/23) | Flow (m3/s)(2021/22) |
|---|---|---|
| 02-May | 1,917 | 2,776 |
| 03-May | 1,932 | 2,799 |
| 04-May | 1,954 | 2,837 |
| 05-May | 1,990 | 2,881 |
| 06-May | 2,023 | 2,917 |
| 07-May | 2,057 | 2,955 |
| 08-May | 2,095 | 2,984 |
| 09-May | 2,135 | 3,000 |
| 10-May | 2,182 | 3,017 |
| 11-May | 2,216 | 3,024 |
| 12-May | 2,266 | 3,032 |
| 13-May | 2,308 | 3,034 |
| 14-May | 2,356 | 3,034 |
| 15-May | 2,400 | 3,029 |
From:
Tuesday, May 2, 2023
To:
Monday, May 15, 2023
Lake Levels Graphic: