Hydrology Banner

Victoria Falls / Big Tree

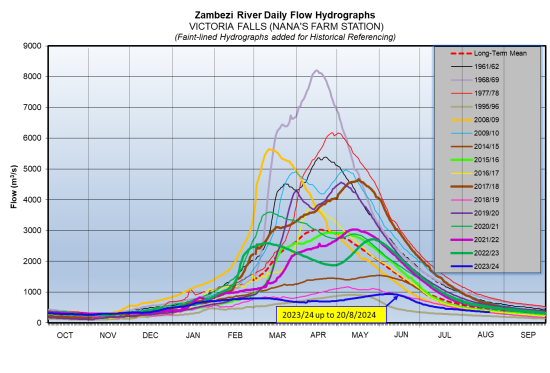
The Zambezi River flows at Victoria Falls are steadily decreasing, closing the period under review at 345m3/s on 20th August 2024.  The flow observed on the same date last year was 500m3/s.

DateFlow (m3/s)(2023/24)Flow (m3/s)(2022/23)
7-Aug391597
8-Aug388587
9-Aug383579
10-Aug381567
11-Aug377562
12-Aug374554
13-Aug369547
14-Aug367536
15-Aug362530
16-Aug357526
17-Aug354517
18-Aug351512
19-Aug347505
20-Aug345500
From: 
Wednesday, August 7, 2024
To: 
Tuesday, August 20, 2024
Lake Levels Graphic: 
vic-falls

Chavuma

The Zambezi River flows at Chavuma are rising steadily as the rainfall season progresses, closing the period under review at 723m3/s as of 26th January 2026, whilst last year on the same date it was lower at 197m3/s.

From:
13 January 2026
To:
26 January 2026
DateFlow (m3/s)(2024/25)Flow (m3/s)(2023/24)
13-Jan399180
14-Jan428182
15-Jan443183
16-Jan465182
17-Jan475181
18-Jan511181
19-Jan557183
20-Jan585186
21-Jan613186
22-Jan677184
23-Jan688186
24-Jan704192
25-Jan713210
26-Jan723197

Ngonye

Flows at Ngonye are increasing with records of fluctuation being observed due to the influence of local rainfall activity, closing the period under review at 754m3/s as of 26th January 2026. The flow recorded last year on the same date was lower at 516m3/s.

From:
13 January 2026
To:
26 January 2026
DateFlow (m3/s)(2024/25)Flow (m3/s)(2023/24)
13-Jan616421
14-Jan626422
15-Jan638425
16-Jan641431
17-Jan650436
18-Jan668444
19-Jan674450
20-Jan675457
21-Jan706471
22-Jan703472
23-Jan707483
24-Jan716500
25-Jan749502
26-Jan754516

Victoria Falls (Nana’s Farm Station)

From:
13 January 2026
To:
26 January 2026
DateFlow (m3/s)(2024/25)Flow (m3/s)(2023/24)
13-Jan542378
14-Jan563397
15-Jan605401
16-Jan627415
17-Jan651420
18-Jan658431
19-Jan674441
20-Jan697458
21-Jan717466
22-Jan748527
23-Jan775517
24-Jan790538
25-Jan828547
26-Jan829547