Hydrology Banner

Victoria Falls (Nana’s Farm Station)

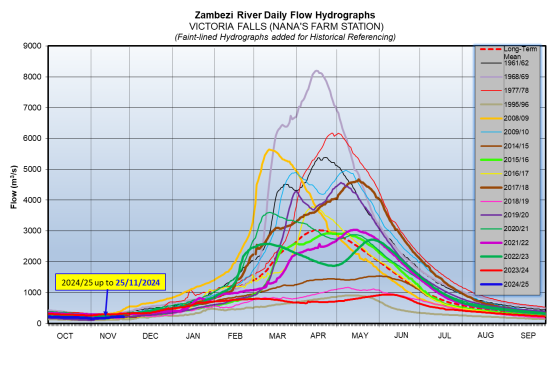
The Zambezi River flows at Victoria Falls are steadily increasing due to rainfall activities being observed around the catchment of interest, closing the period under review at 227m3/s on 25th November 2024.  The flow observed on the same date last year was 319m3/s.

DateFlow (m3/s)(2023/24)Flow (m3/s)(2022/23)
12-Nov178294
13-Nov180293
14-Nov184293
15-Nov191288
16-Nov203292
17-Nov204293
18-Nov206294
19-Nov211294
20-Nov216297
21-Nov222298
22-Nov223307
23-Nov224307
24-Nov224313
25-Nov227319
From: 
Tuesday, November 12, 2024
To: 
Monday, November 25, 2024
Lake Levels Graphic: 
vic-falls

Chavuma

The Zambezi River flows at Chavuma are decreasing after peaking to 3,851m3/s as at 18th March 2026, before dropping to 2,922m3/s at the close of the period under review of 30th March 2026, whilst last year on the same date it was lower at 2,554m3/s.

From:
17 March 2026
To:
30 March 2026
DateFlow (m3/s)(2025/26)Flow (m3/s)(2024/25)
17-Mar3,8052,101
18-Mar3,8512,148
19-Mar3,7732,244
20-Mar3,6262,390
21-Mar3,4322,538
22-Mar3,2712,677
23-Mar3,1362,722
24-Mar2,9892,742
25-Mar2,8642,731
26-Mar2,7682,697
27-Mar2,8462,632
28-Mar2,9132,584
29-Mar2,9292,570
30-Mar2,9222,554

Ngonye

Flows at Ngonye are steadily decreasing, with fluctuations being observed in the flows, closing the period under review at 4,199m3/s as of 30th March 2026. The flow recorded last year on the same date was lower at 2,261m3/s.

From:
17 March 2026
To:
30 March 2026
DateFlow (m3/s)(2025/26)Flow (m3/s)(2024/25)
17-Mar4,1961,902
18-Mar4,2071,995
19-Mar4,1992,062
20-Mar4,1902,101
21-Mar4,2532,142
22-Mar4,2702,179
23-Mar4,2862,201
24-Mar4,2752,221
25-Mar4,2532,237
26-Mar4,2342,239
27-Mar4,2262,246
28-Mar4,2232,257
29-Mar4,2012,261
30-Mar4,1992,261

Victoria Falls (Nana’s Farm Station)

The Zambezi River flows at Victoria Falls – Nana’s Farm Station are increasing as rainfall season progresses, closing the period under review at 4,206m3/s as of 30th March 2026.  The flow observed on the same date last year was lower at 1,647m3/s.

From:
17 March 2026
To:
30 March 2026
DateFlow (m3/s)(2025/26)Flow (m3/s)(2024/25)
17-Mar3,313984
18-Mar3,5561,012
19-Mar3,7021,049
20-Mar3,8401,080
21-Mar3,9661,123
22-Mar4,0351,160
23-Mar4,0901,216
24-Mar4,1361,271
25-Mar4,1521,325
26-Mar4,1651,385
27-Mar4,1871,447
28-Mar4,1921,519
29-Mar4,2001,586
30-Mar4,2061,647