Hydrology Banner

Victoria Falls / Big Tree

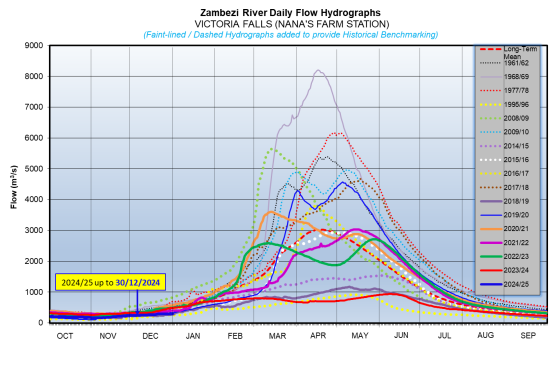
The Zambezi River flows at Victoria Falls are steadily increasing with records of fluctuation due to rainfall activities being observed around the catchment of interest, closing the period under review at 305m3/s on 30th December 2024.  The flow observed on the same date last year was slightly higher at 486m3/s.

17-Dec273374
18-Dec285377
19-Dec294382
20-Dec293392
21-Dec297403
22-Dec293417
23-Dec292430
24-Dec292436
25-Dec292447
26-Dec289457
27-Dec292472
28-Dec303482
29-Dec296481
30-Dec305486
From: 
Tuesday, December 17, 2024
To: 
Monday, December 30, 2024
Lake Levels Graphic: 
Chavuma

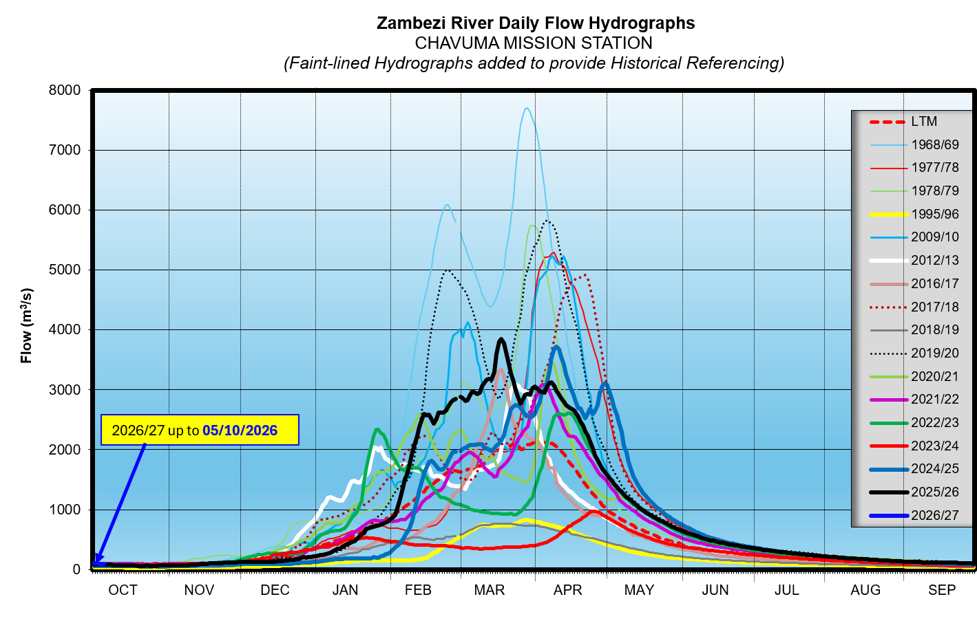
The Zambezi River flows at Chavuma are in recession, closing the period under review at 169m3/s as of 17th August 2026, whilst last year on the same date it was at 165m3/s. 

From:
4 August 2026
To:
17 August 2026
DateFlow (m3/s)(2025/26)Flow (m3/s)(2024/25)
4-Aug204203
5-Aug202201
6-Aug199199
7-Aug196196
8-Aug191192
9-Aug189189
10-Aug186186
11-Aug183183
12-Aug181180
13-Aug177176
14-Aug175173
15-Aug173170
16-Aug171168
17-Aug169165

Ngonye

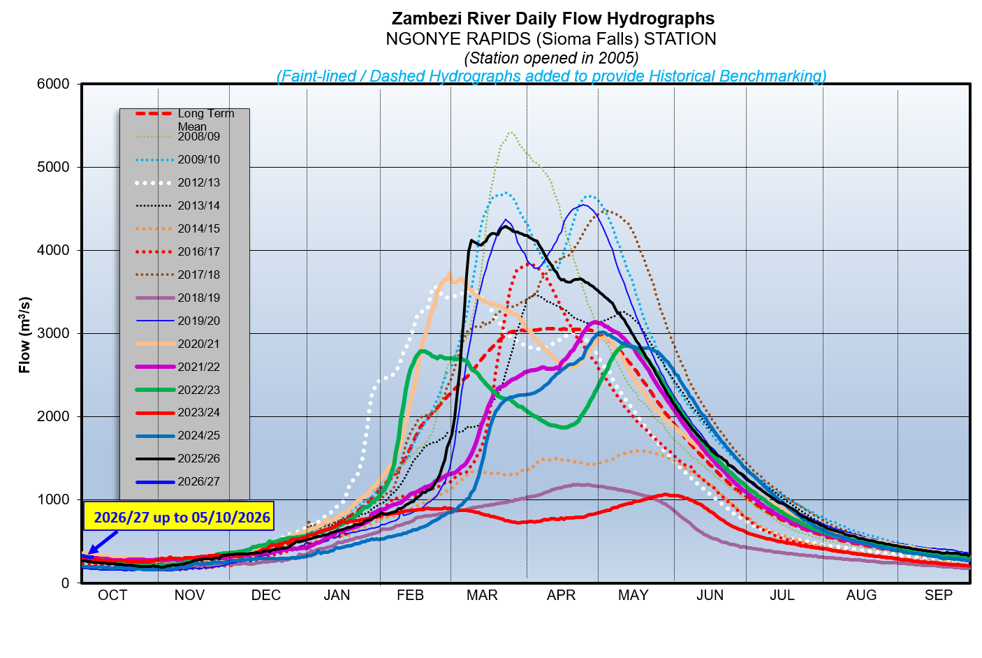
Flows at Ngonye are steadily decreasing, closing the period under review at 535m3/s as of 17th August 2026. The flow recorded last year on the same date was at 487m3/s.

From:
4 August 2026
To:
17 August 2026
DateFlow (m3/s)(2025/26)Flow (m3/s)(2024/25)
4-Aug649599
5-Aug635590
6-Aug631577
7-Aug618570
8-Aug609555
9-Aug600545
10-Aug590539
11-Aug577532
12-Aug569527
13-Aug566516
14-Aug557510
15-Aug548500
16-Aug539494
17-Aug535487

Victoria Falls (Nana’s Farm Station)

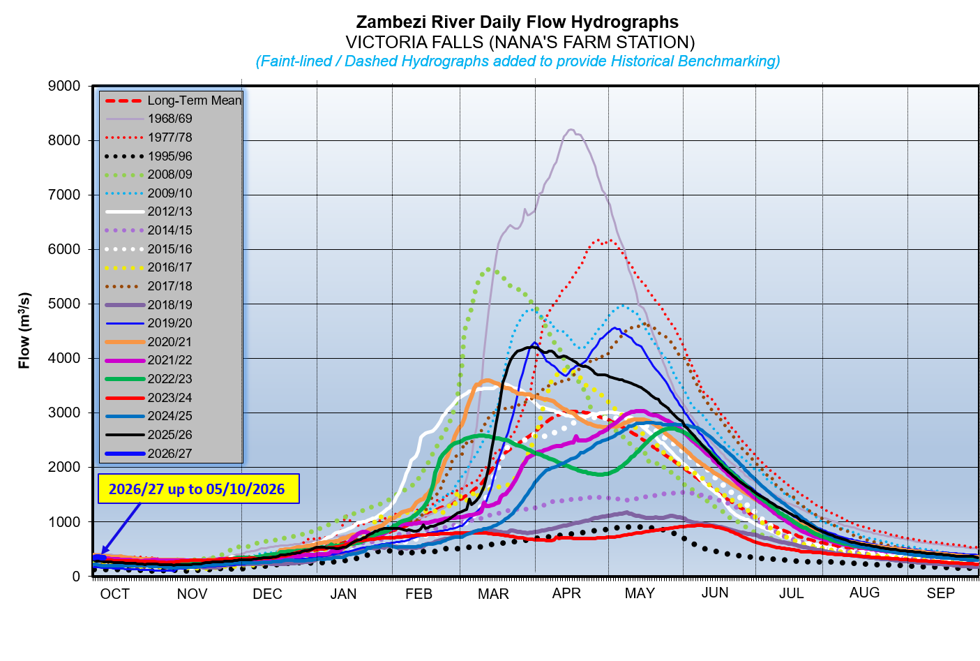
The Zambezi River flows at Victoria Falls – Nana’s Farm Station are steadily decreasing, closing the period under review at 564m3/s as of 17th August 2026.  The flow observed on the same date last year was at 513m3/s.

From:
4 August 2026
To:
17 August 2026
DateFlow (m3/s)(2025/26)Flow (m3/s)(2024/25)
4-Aug703665
5-Aug691648
6-Aug674626
7-Aug661616
8-Aug641606
9-Aug631594
10-Aug624581
11-Aug613570
12-Aug601562
13-Aug590550
14-Aug582540
15-Aug578530
16-Aug570519
17-Aug564513