Hydrology Banner

Victoria Falls / Big Tree

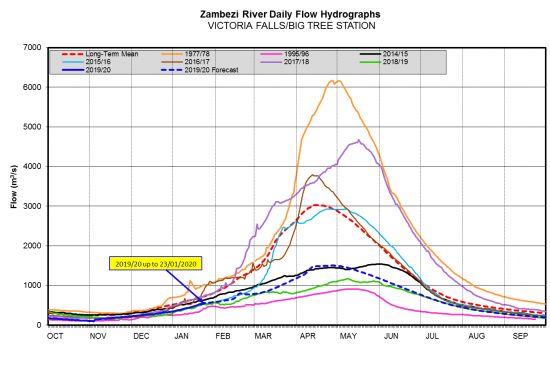
Flows at Victoria Falls have continued to increase steadily during the period under review before closing at 548m3/s on 23rd January 2020. Last year on the same date, the flow was 524m3/s. The Zambezi River flows at Victoria Falls are still below the long-term average. This situation of below average flows at this station is forecasted to continue throughout the season to September 2020 as depicted in the respective hydrograph (dashed blue line).

Date20202019
10/1/2020426406
11/1/2020431436
12/1/2020436426
13/1/2020447421
14/1/2020457416
15/1/2020468426
16/1/2020479436
17/1/2020490452
18/1/2020501479
19/1/2020513490
20/1/2020524501
21/1/2020530513
22/1/2020536519
23/1/2020548524
From: 
Friday, January 10, 2020
To: 
Thursday, January 23, 2020
Lake Levels Graphic: 
vic falls

Chavuma

The Zambezi River flows at Chavuma are decreasing after peaking to 3,851m3/s as at 18th March 2026, before dropping to 2,922m3/s at the close of the period under review of 30th March 2026, whilst last year on the same date it was lower at 2,554m3/s.

From:
17 March 2026
To:
30 March 2026
DateFlow (m3/s)(2025/26)Flow (m3/s)(2024/25)
17-Mar3,8052,101
18-Mar3,8512,148
19-Mar3,7732,244
20-Mar3,6262,390
21-Mar3,4322,538
22-Mar3,2712,677
23-Mar3,1362,722
24-Mar2,9892,742
25-Mar2,8642,731
26-Mar2,7682,697
27-Mar2,8462,632
28-Mar2,9132,584
29-Mar2,9292,570
30-Mar2,9222,554

Ngonye

Flows at Ngonye are steadily decreasing, with fluctuations being observed in the flows, closing the period under review at 4,199m3/s as of 30th March 2026. The flow recorded last year on the same date was lower at 2,261m3/s.

From:
17 March 2026
To:
30 March 2026
DateFlow (m3/s)(2025/26)Flow (m3/s)(2024/25)
17-Mar4,1961,902
18-Mar4,2071,995
19-Mar4,1992,062
20-Mar4,1902,101
21-Mar4,2532,142
22-Mar4,2702,179
23-Mar4,2862,201
24-Mar4,2752,221
25-Mar4,2532,237
26-Mar4,2342,239
27-Mar4,2262,246
28-Mar4,2232,257
29-Mar4,2012,261
30-Mar4,1992,261

Victoria Falls (Nana’s Farm Station)

The Zambezi River flows at Victoria Falls – Nana’s Farm Station are increasing as rainfall season progresses, closing the period under review at 4,206m3/s as of 30th March 2026.  The flow observed on the same date last year was lower at 1,647m3/s.

From:
17 March 2026
To:
30 March 2026
DateFlow (m3/s)(2025/26)Flow (m3/s)(2024/25)
17-Mar3,313984
18-Mar3,5561,012
19-Mar3,7021,049
20-Mar3,8401,080
21-Mar3,9661,123
22-Mar4,0351,160
23-Mar4,0901,216
24-Mar4,1361,271
25-Mar4,1521,325
26-Mar4,1651,385
27-Mar4,1871,447
28-Mar4,1921,519
29-Mar4,2001,586
30-Mar4,2061,647