Hydrology Banner

Victoria Falls / Big Tree

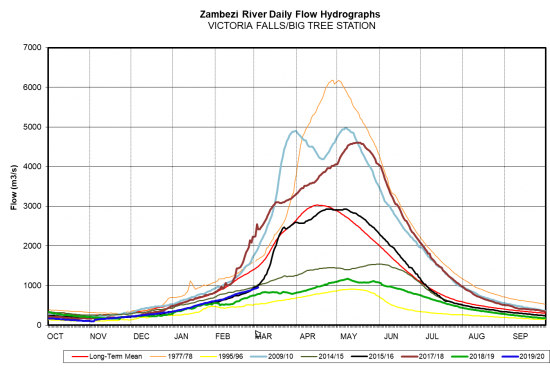
Flows at Victoria Falls have continued to increase steadily during the period under review before closing at 955m3/s on 3rd March 2020. Last year on the same date, the flow was 785m3/s. The Zambezi River flows at Victoria Falls are still below the long-term mean.

DateFlow (m3/s) 2020Flow (m3/s) 2019
19/2/2020816636
20/2/2020824656
21/2/2020831670
22/2/2020839677
23/2/2020847684
24/2/2020855691
25/2/2020863705
26/2/2020879733
27/2/2020888741
28/2/2020904748
29/2/2020921748
1/3/2020929763
2/3/2020938778
3/3/2020955785
From: 
Wednesday, February 19, 2020
To: 
Tuesday, March 3, 2020
Lake Levels Graphic: 
vic falls

Chavuma

The Zambezi River flows at Chavuma are in recession, closing the period under review at 65m3/s as of 20th October 2025, whilst last year on the same date it was lower at 54m3/s.

From:
7 October 2025
To:
20 October 2025
DateFlow (m3/s)(2024/25)Flow (m3/s)(2023/24)
7-Oct7863
8-Oct7862
9-Oct7761
10-Oct7661
11-Oct7660
12-Oct7560
13-Oct7459
14-Oct7257
15-Oct7257
16-Oct7056
17-Oct6855
18-Oct6855
19-Oct6655
20-Oct6554

Ngonye

The Zambezi River flows at Chavuma are in recession, closing the period under review at 65m3/s as of 20th October 2025, whilst last year on the same date it was lower at 54m3/s.

From:
7 October 2025
To:
20 October 2025
DateFlow (m3/s)(2024/25)Flow (m3/s)(2023/24)
7-Oct248191
8-Oct246195
9-Oct244191
10-Oct243189
11-Oct235186
12-Oct234183
13-Oct236183
14-Oct230183
15-Oct228196
16-Oct227186
17-Oct222185
18-Oct220182
19-Oct216178
20-Oct214176

Victoria Falls (Nana’s Farm Station)

The Zambezi River flows at Chavuma are in recession, closing the period under review at 65m3/s as of 20th October 2025, whilst last year on the same date it was lower at 54m3/s.

From:
7 October 2025
To:
20 October 2025
DateFlow (m3/s)(2024/25)Flow (m3/s)(2023/24)
7-Oct268203
8-Oct264203
9-Oct260203
10-Oct256200
11-Oct254199
12-Oct253198
13-Oct252196
14-Oct247197
15-Oct243197
16-Oct241195
17-Oct240196
18-Oct236197
19-Oct233197
20-Oct230196